Fig. 3
Download original image
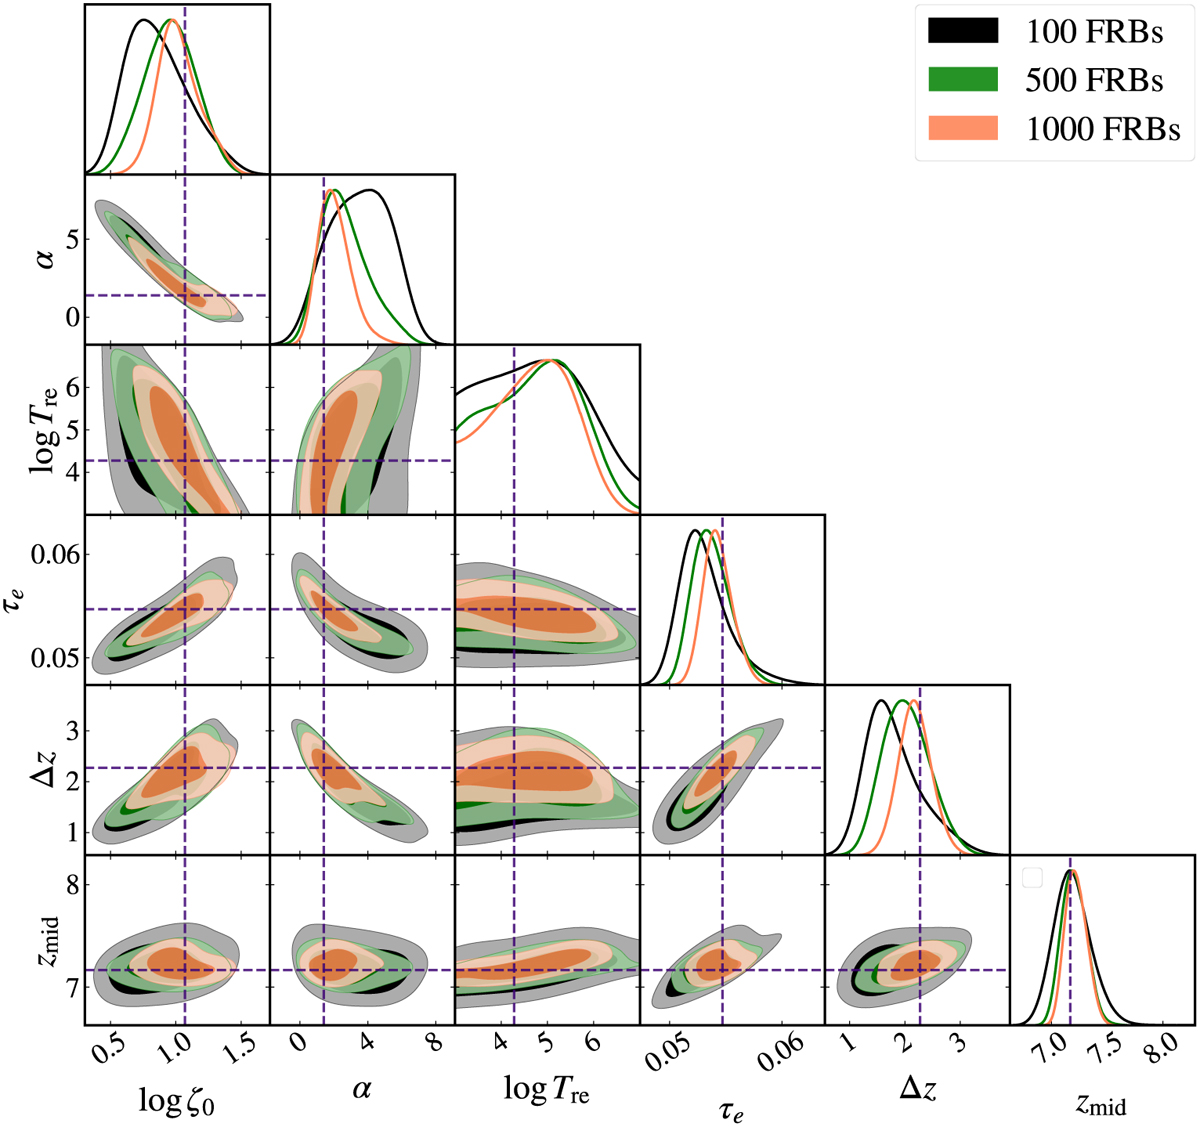
Comparison of the parameter posteriors for three different sets of FRB mocks, i.e., with 100 (black), 500 (green) and 1000 (orange) samples. The diagonal panels show the 1D posterior probability distribution, and the off diagonal panels show the joint 2D posteriors. The contours represent the 68% and 95% confidence intervals. The dashed line represents the input parameter values used to generate the reioniza-tion model, which has further been used to create the FRB mocks.
Current usage metrics show cumulative count of Article Views (full-text article views including HTML views, PDF and ePub downloads, according to the available data) and Abstracts Views on Vision4Press platform.
Data correspond to usage on the plateform after 2015. The current usage metrics is available 48-96 hours after online publication and is updated daily on week days.
Initial download of the metrics may take a while.