Fig. 1
Download original image
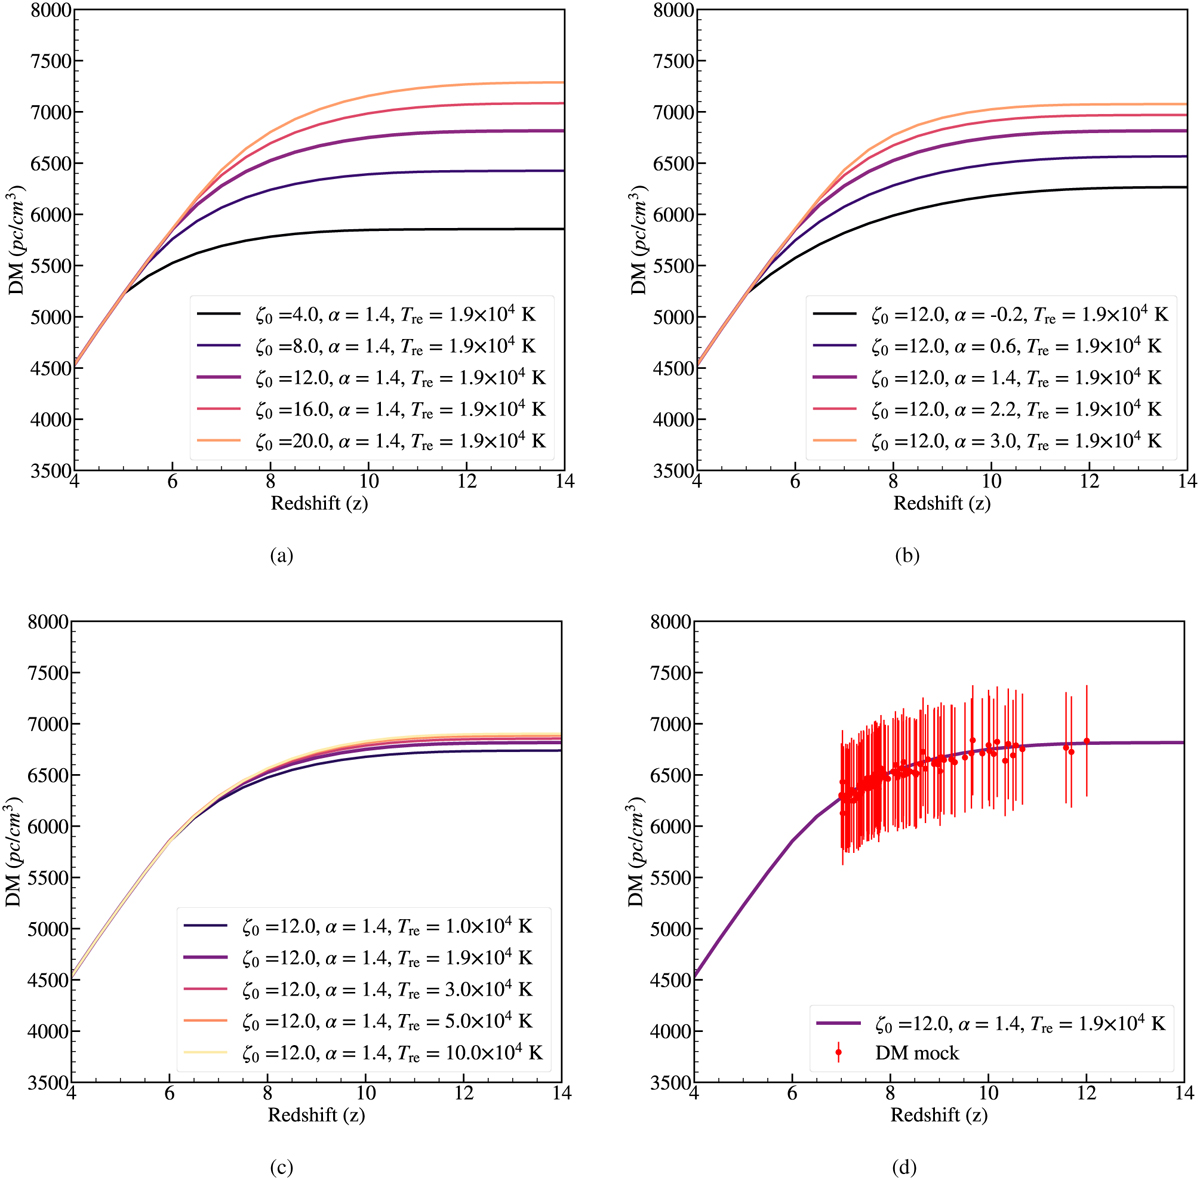
Plots of DM variations with redshift for different parameters. The first three panels (a, b, and c) show the variation in the globally averaged Dispersion Measure (DM) as a function of redshift for the different free parameters in our model (i.e., ζ0, α, and Tre). We show in panel a the DM-z variation for different ζ0 models; in panel b the DM-z variation for different α models; and in panel c the DM-z variation for different Tre models. We used ζ0 = 12, α = 1.4, and Tre = 1.9 × 10⁴ K as our fiducial model parameters in the analysis. For each case, we show the plots for five different parameter values. The last panel d shows the fiducial mock DM values (at true redshifts) for 100 samples along with the corresponding input model. The mock data were generated assuming a typical expectation from upcoming facilities such as the SKA.
Current usage metrics show cumulative count of Article Views (full-text article views including HTML views, PDF and ePub downloads, according to the available data) and Abstracts Views on Vision4Press platform.
Data correspond to usage on the plateform after 2015. The current usage metrics is available 48-96 hours after online publication and is updated daily on week days.
Initial download of the metrics may take a while.