Fig. 4.
Download original image
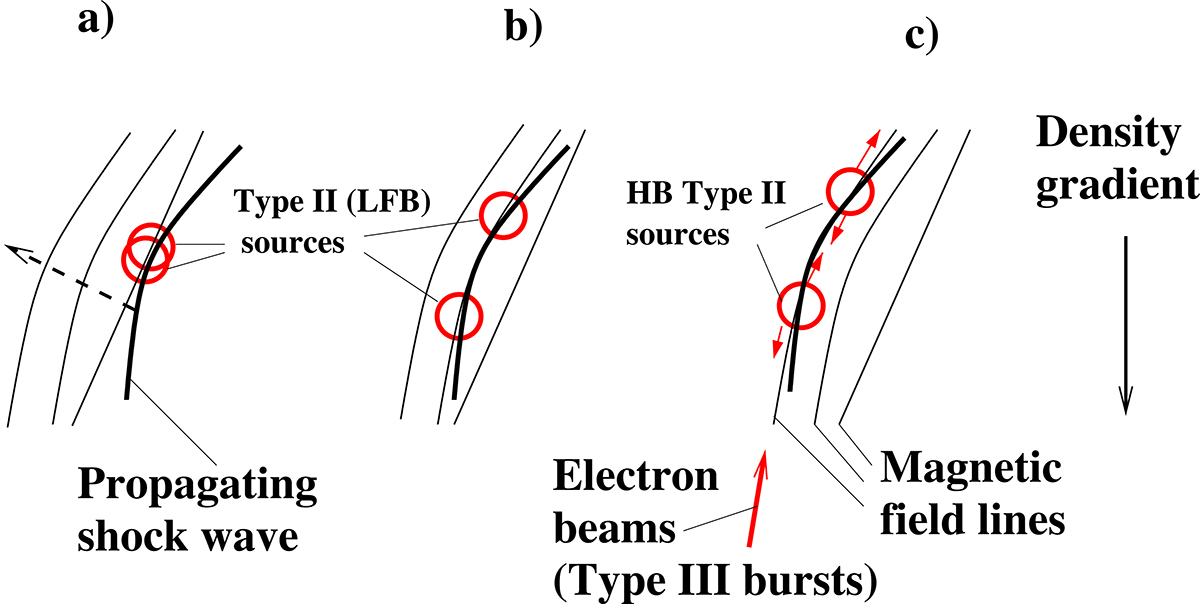
Sketch demonstrating the possible scenario of the occurrence of the spectral cleaving in the Type II (LFB) step by step: (a) Phase before the cleaving (∼13:09:30 UT). (b) Phase after the cleaving (∼13:10:00 UT). (c) Phase after the cleaving with herringbones (∼13:11:00 UT). The short red arrows indicate the electron beams that generate herringbones.
Current usage metrics show cumulative count of Article Views (full-text article views including HTML views, PDF and ePub downloads, according to the available data) and Abstracts Views on Vision4Press platform.
Data correspond to usage on the plateform after 2015. The current usage metrics is available 48-96 hours after online publication and is updated daily on week days.
Initial download of the metrics may take a while.