Fig. 3.
Download original image
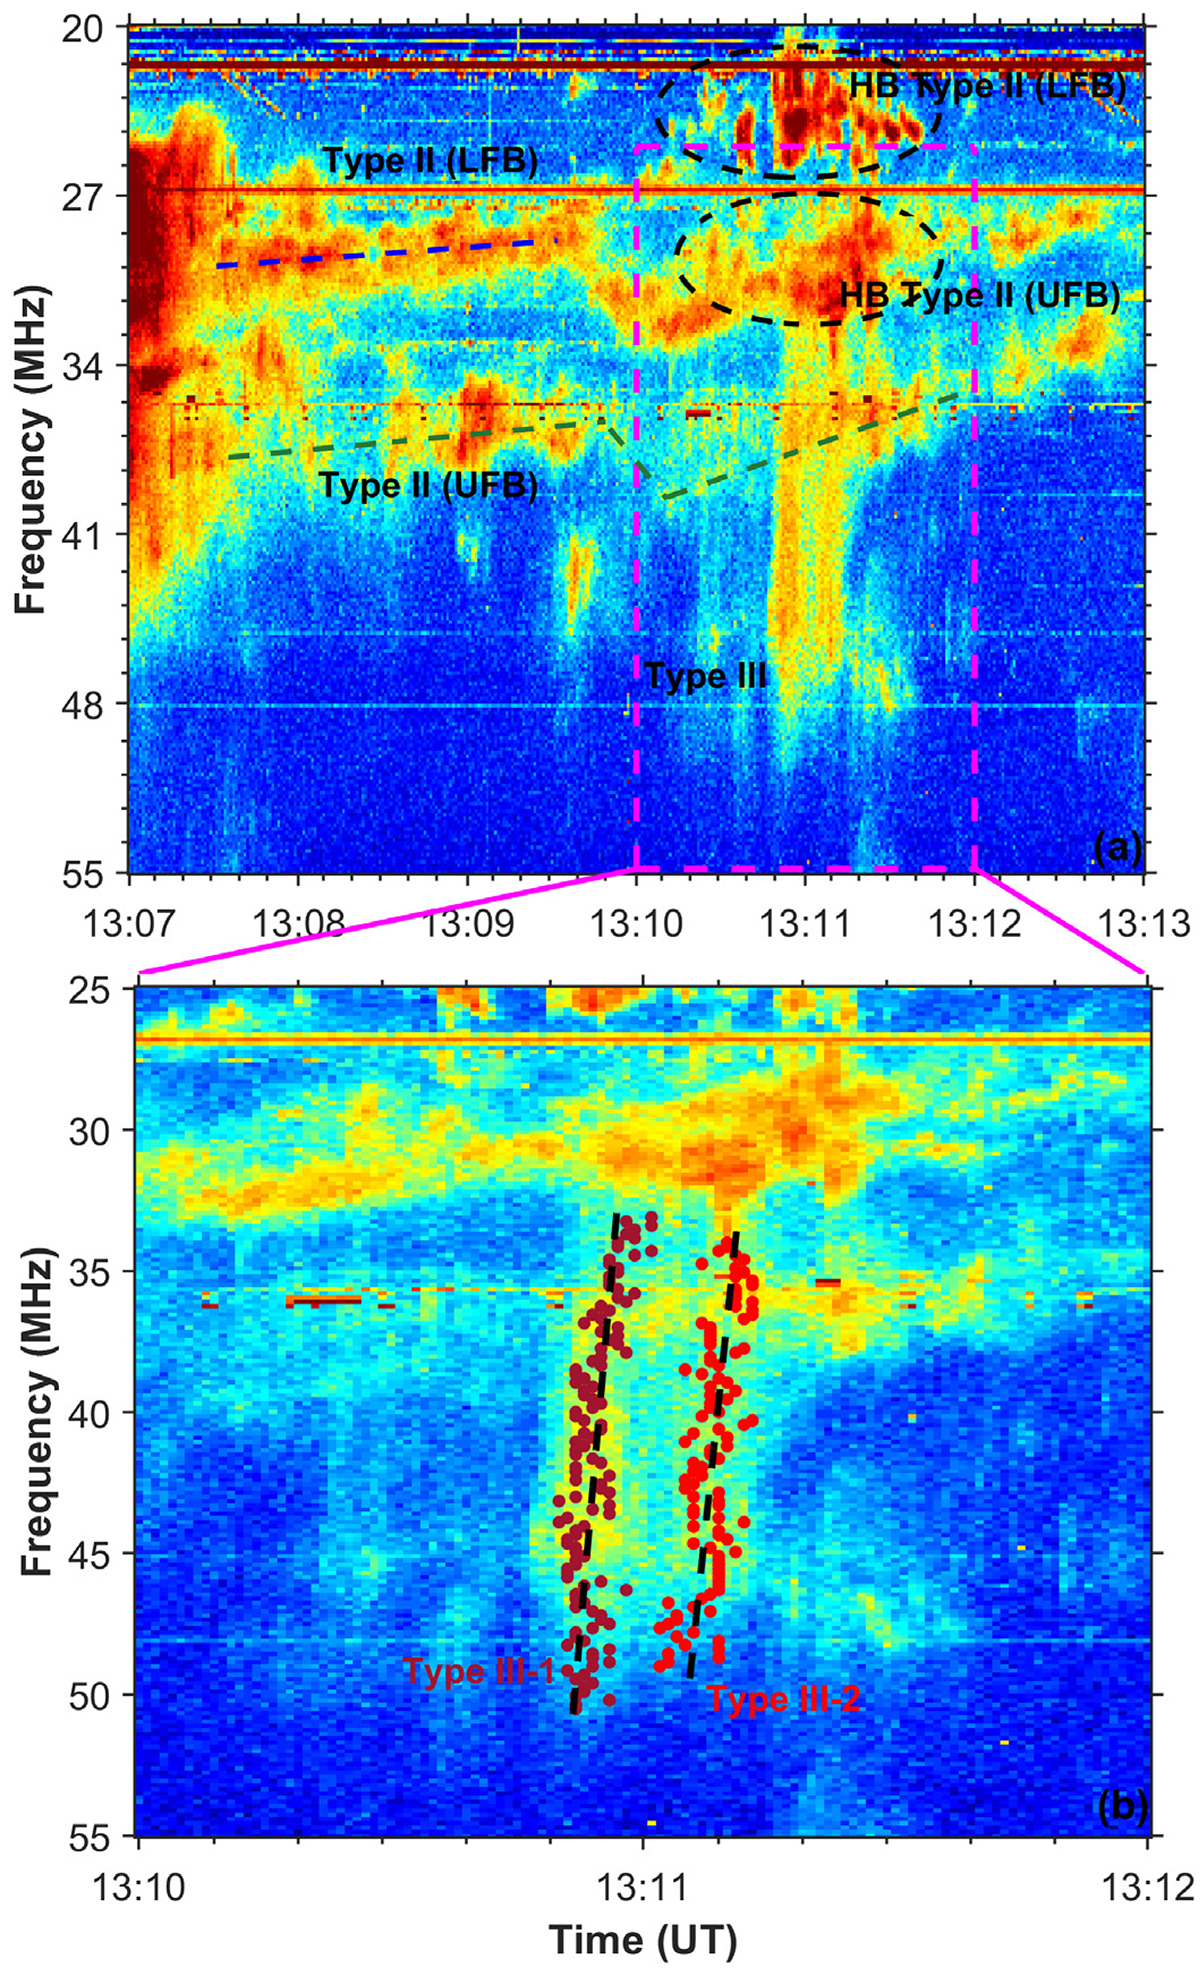
NDA dynamic spectra with type II and type III bursts on 2011 February 14. (a) NDA dynamic spectrum with the lower and upper frequency bands of the type II burst (Type II (LFB) and Type II (UFB)) as well as the type II burst with herringbones (HB Type II (LFB) and HB Type II (UFB)). Type II (LFB) and Type II (UFB) are indicated by dashed blue and dark green lines. HB Type II (LFB) and HB Type II (UFB) are delineated by dashed black ellipses. Two type III bursts are marked as Type III. (b) NDA dynamic spectrum with the first and second type III bursts, which are labeled Type III-1 and Type III-2. The intensity maxima in each frequency channel along the bursts are shown by brown and red dots for Type III-1 and Type III-2, respectively. The dashed black lines are approximations by linear curves indicating frequency drifts.
Current usage metrics show cumulative count of Article Views (full-text article views including HTML views, PDF and ePub downloads, according to the available data) and Abstracts Views on Vision4Press platform.
Data correspond to usage on the plateform after 2015. The current usage metrics is available 48-96 hours after online publication and is updated daily on week days.
Initial download of the metrics may take a while.