Fig. 1.
Download original image
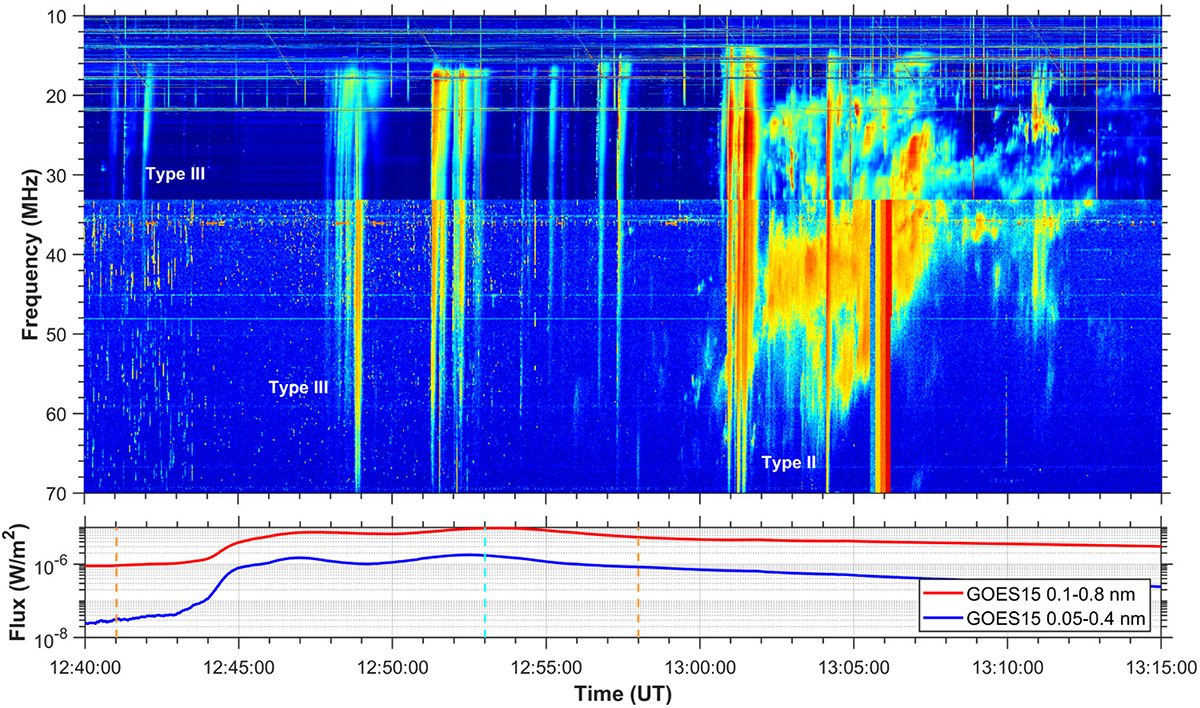
Dynamic spectrum of the type II burst on 2011 February 14. The combined spectrum was obtained from records of the URAN-2 (10–33 MHz) and NDA (33–70 MHz) antenna arrays. The type II burst and several groups of type III bursts are denoted in the spectrogram as Type II and Type III, respectively. The lower panel shows the solar X-ray emission measured by GOES 15 on that day. The C9.4 class flare start, end, and peak times are shown as dashed vertical orange and cyan lines, respectively. The common time axis is in the range 12:40–13:15 UT.
Current usage metrics show cumulative count of Article Views (full-text article views including HTML views, PDF and ePub downloads, according to the available data) and Abstracts Views on Vision4Press platform.
Data correspond to usage on the plateform after 2015. The current usage metrics is available 48-96 hours after online publication and is updated daily on week days.
Initial download of the metrics may take a while.