Fig. A.1
Download original image
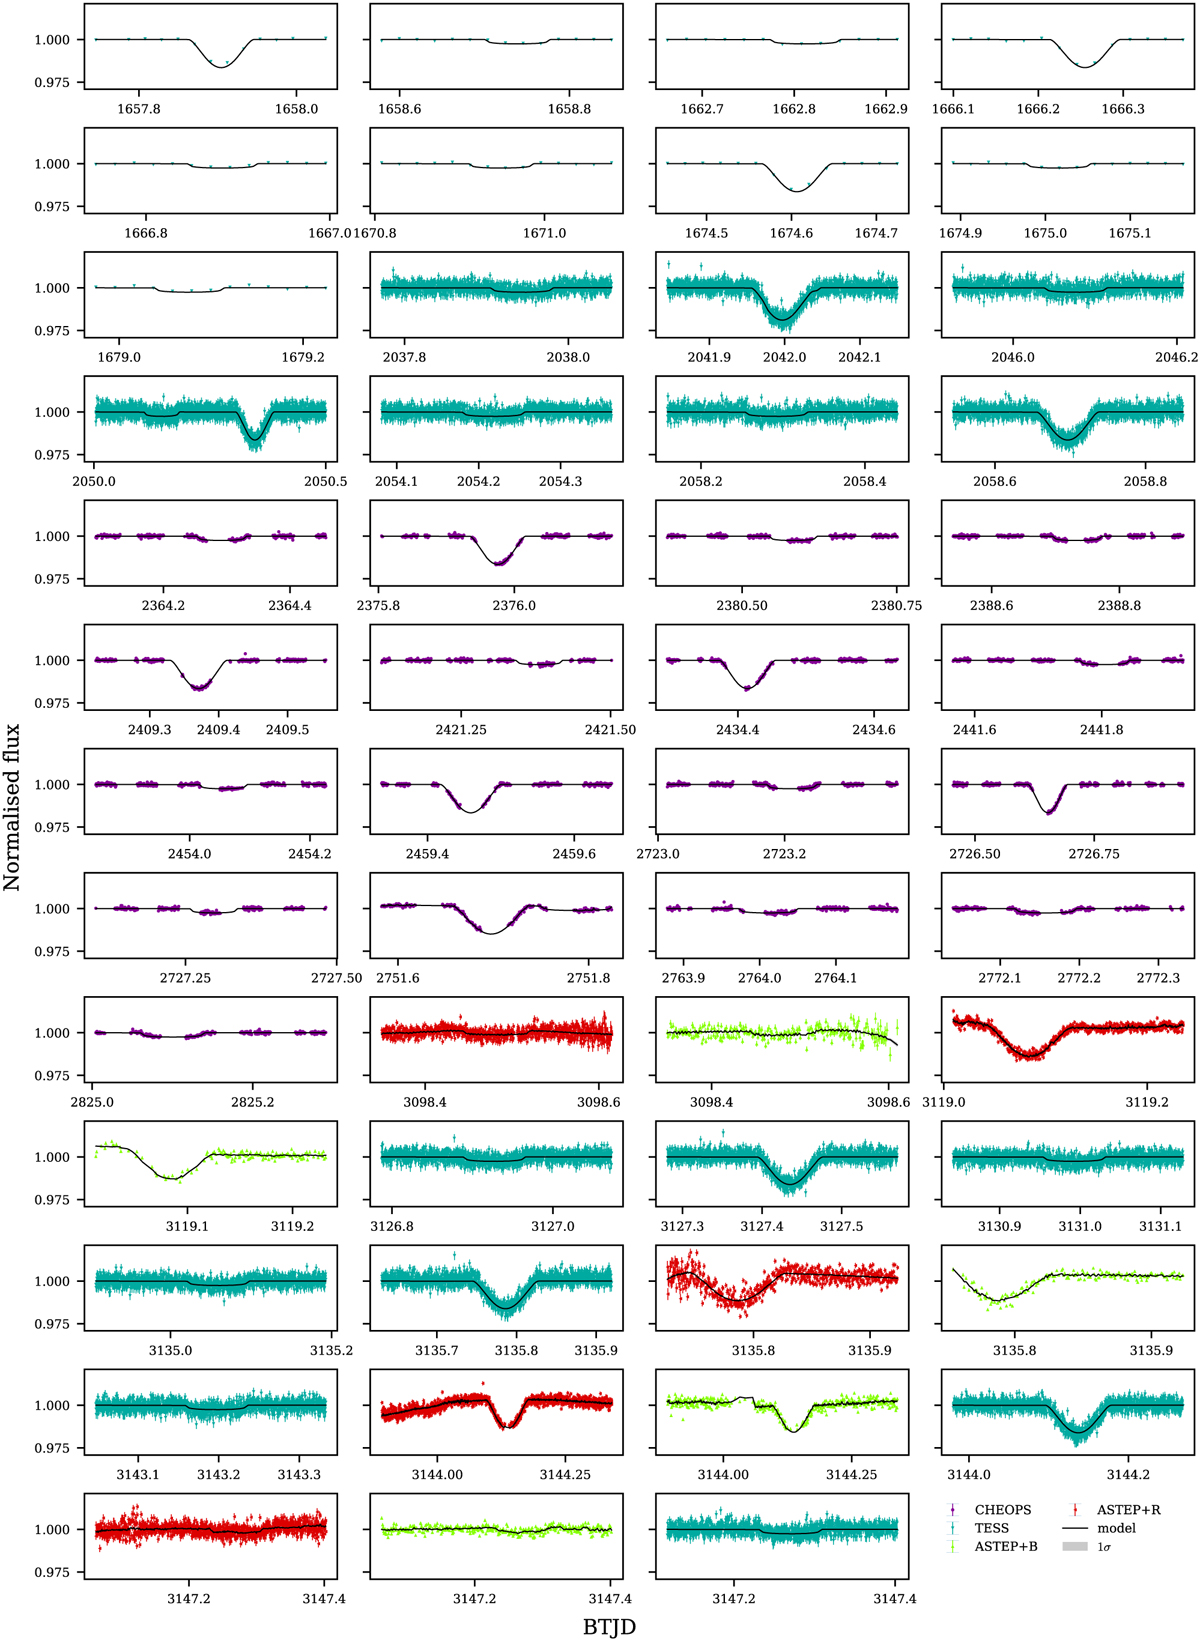
Photometry of each light curve used in the photo-dynamical analysis. Each panel has the data (filled markers, different marker and colour based on the facilities, see legend) with error-bars, and the over-plotted (over-sampled) full model (black line, transit and detrending) computed with the MAP parameter set from TRADES. Model uncertainties plotted as grey-shaded area at 1σ, but barely visible. Times in BTJD = BJDTDB − 2 457 000.
Current usage metrics show cumulative count of Article Views (full-text article views including HTML views, PDF and ePub downloads, according to the available data) and Abstracts Views on Vision4Press platform.
Data correspond to usage on the plateform after 2015. The current usage metrics is available 48-96 hours after online publication and is updated daily on week days.
Initial download of the metrics may take a while.