Open Access
Fig. 8
Download original image
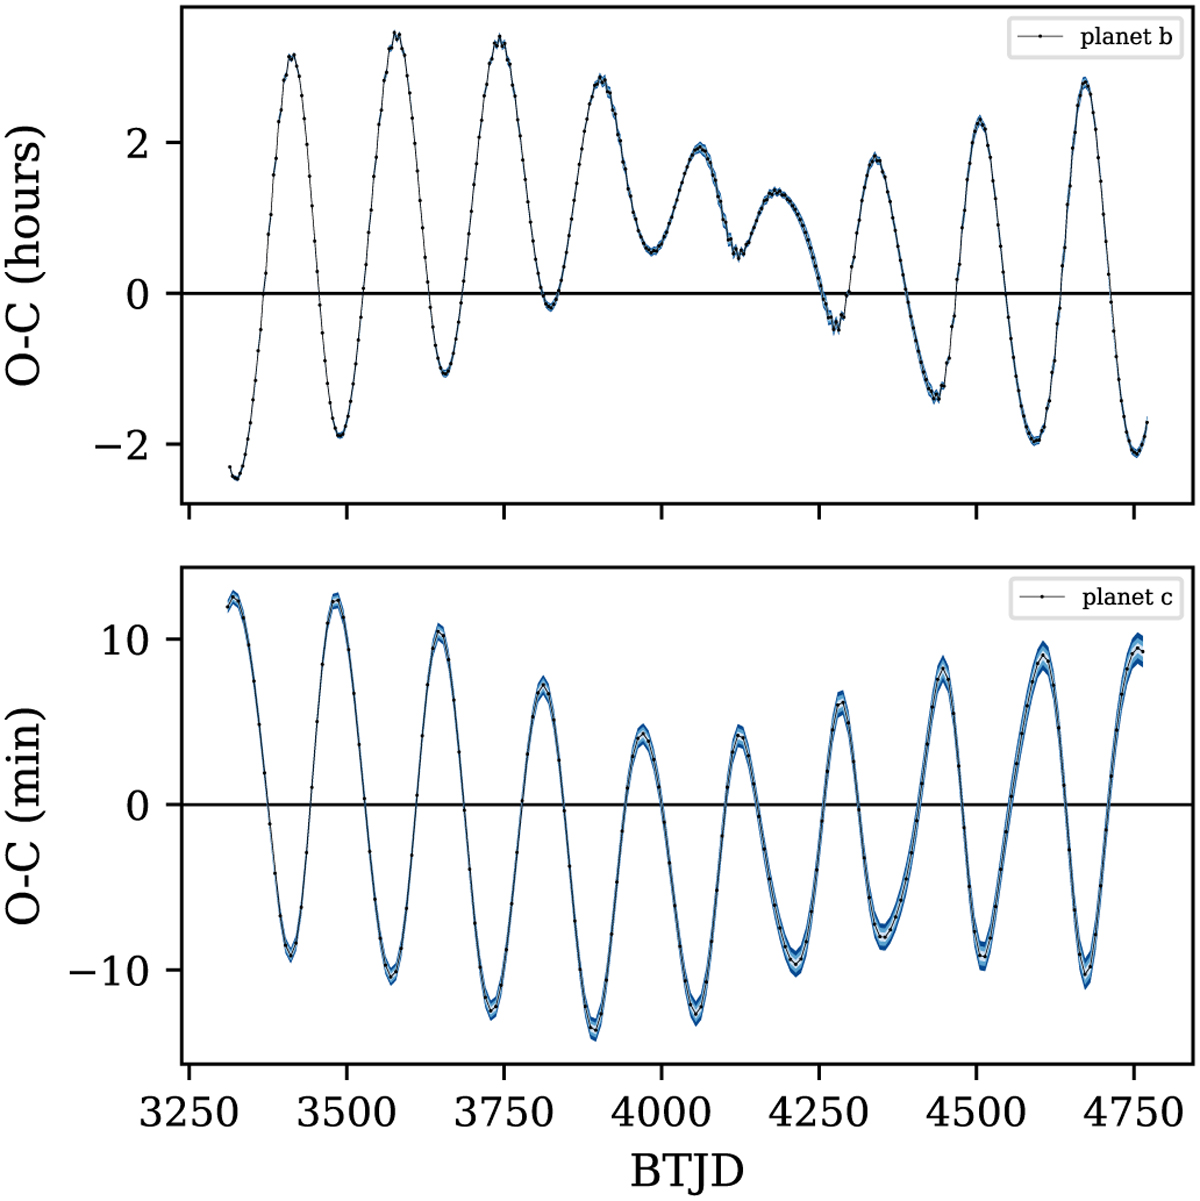
O-C diagram of the synthetic T0s predicted with the MAP orbital solution (black dots are connected by a black line) from the photo-TRADES analysis. Uncertainty plotted as 3σ in dark-blue, 2σ in light-blue, and 1σ whitish-blue. The x-axis in BTJD = BJDTDB −2 457 000 ranges from 2024 until 2028.
Current usage metrics show cumulative count of Article Views (full-text article views including HTML views, PDF and ePub downloads, according to the available data) and Abstracts Views on Vision4Press platform.
Data correspond to usage on the plateform after 2015. The current usage metrics is available 48-96 hours after online publication and is updated daily on week days.
Initial download of the metrics may take a while.