Fig. 2
Download original image
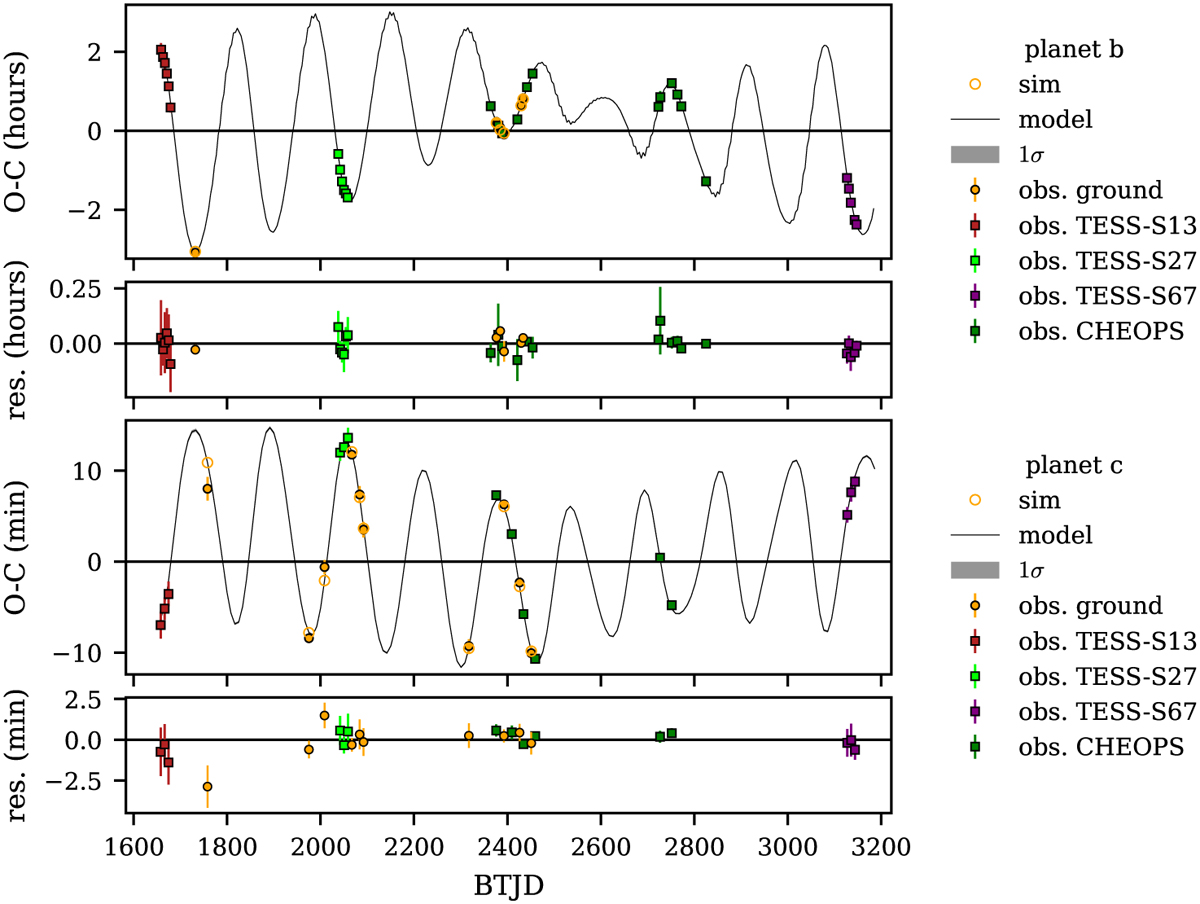
Observed minus calculated (O − C) diagram of TOI-1130 b (top) and TOI-1130 c (bottom) from the photo-dynamical fit with TRADES of the ground-based T0s (orange and black circles, with the simulated ones being as open orange circles) of photometry described in Sec. 4.1. The O − C has been computed with the linear ephemeris in Tables A.2 and A.3. Observed transit times of TESS and CHEOPS, not used in the fit, have been over-plotted (as colour-coded squares) on the O − C and residual panels, full MAP model as black line with 1σ grey-shaded area, that is almost invisible because the model is very well constrained. Times in BTJD = BJDTDB − 2 457 000.
Current usage metrics show cumulative count of Article Views (full-text article views including HTML views, PDF and ePub downloads, according to the available data) and Abstracts Views on Vision4Press platform.
Data correspond to usage on the plateform after 2015. The current usage metrics is available 48-96 hours after online publication and is updated daily on week days.
Initial download of the metrics may take a while.