Fig. D.7
Download original image
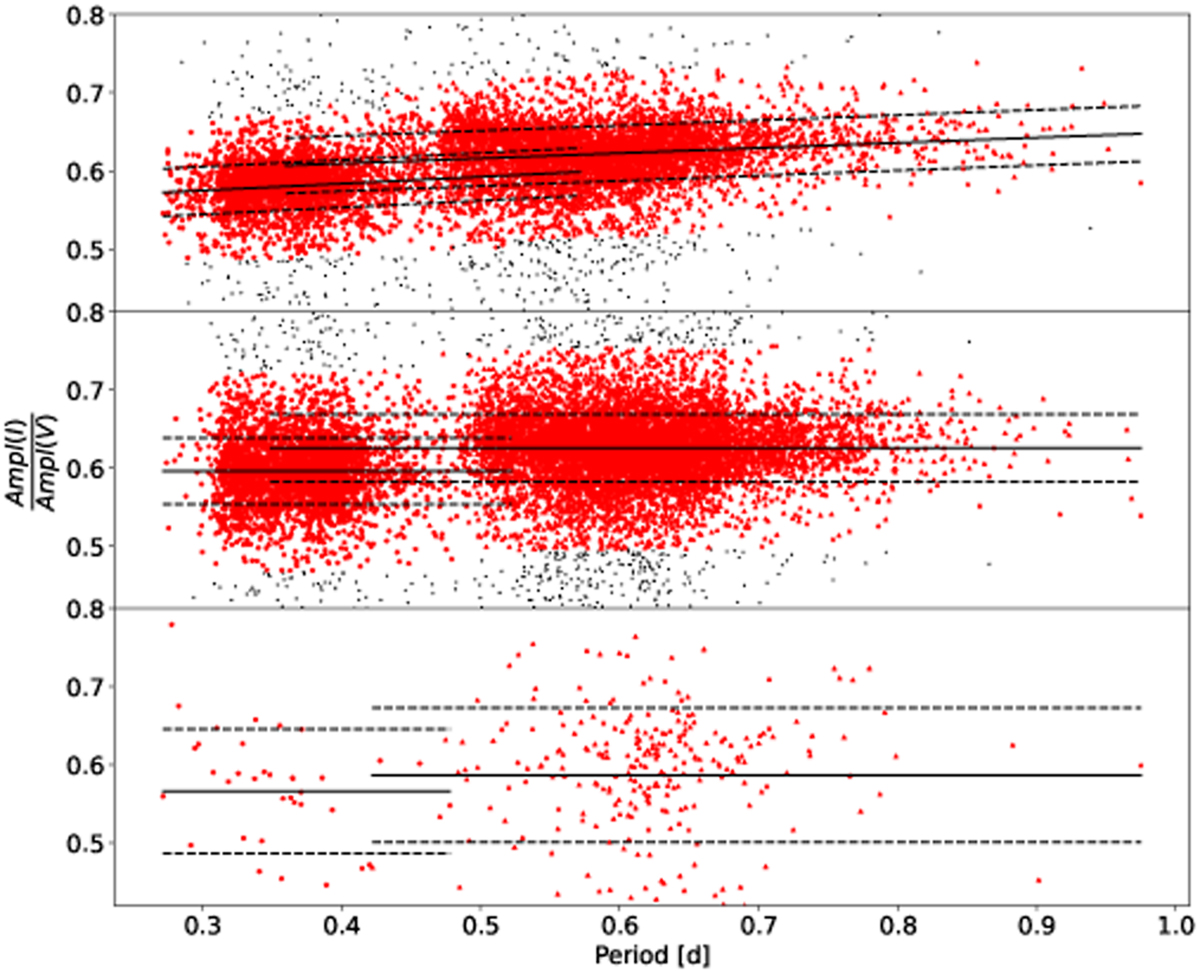
OGLE passbands amplitude ratios. Top: ![]() ratios for the RRLs of the bulge. The red circles (triangles) display the RRc (RRab) that passed a recursive sigma clipping (cut at 2σ) for the linear fit. The black solid lines display the linear fits of the two samples. The black dashed lines display the standard deviation of the linear fit. Middle: Same as top but for the LMC sample. In this case, the fit is a constant. Bottom: Same as middle but for the SMC sample.
ratios for the RRLs of the bulge. The red circles (triangles) display the RRc (RRab) that passed a recursive sigma clipping (cut at 2σ) for the linear fit. The black solid lines display the linear fits of the two samples. The black dashed lines display the standard deviation of the linear fit. Middle: Same as top but for the LMC sample. In this case, the fit is a constant. Bottom: Same as middle but for the SMC sample.
Current usage metrics show cumulative count of Article Views (full-text article views including HTML views, PDF and ePub downloads, according to the available data) and Abstracts Views on Vision4Press platform.
Data correspond to usage on the plateform after 2015. The current usage metrics is available 48-96 hours after online publication and is updated daily on week days.
Initial download of the metrics may take a while.