Fig. 1
Download original image
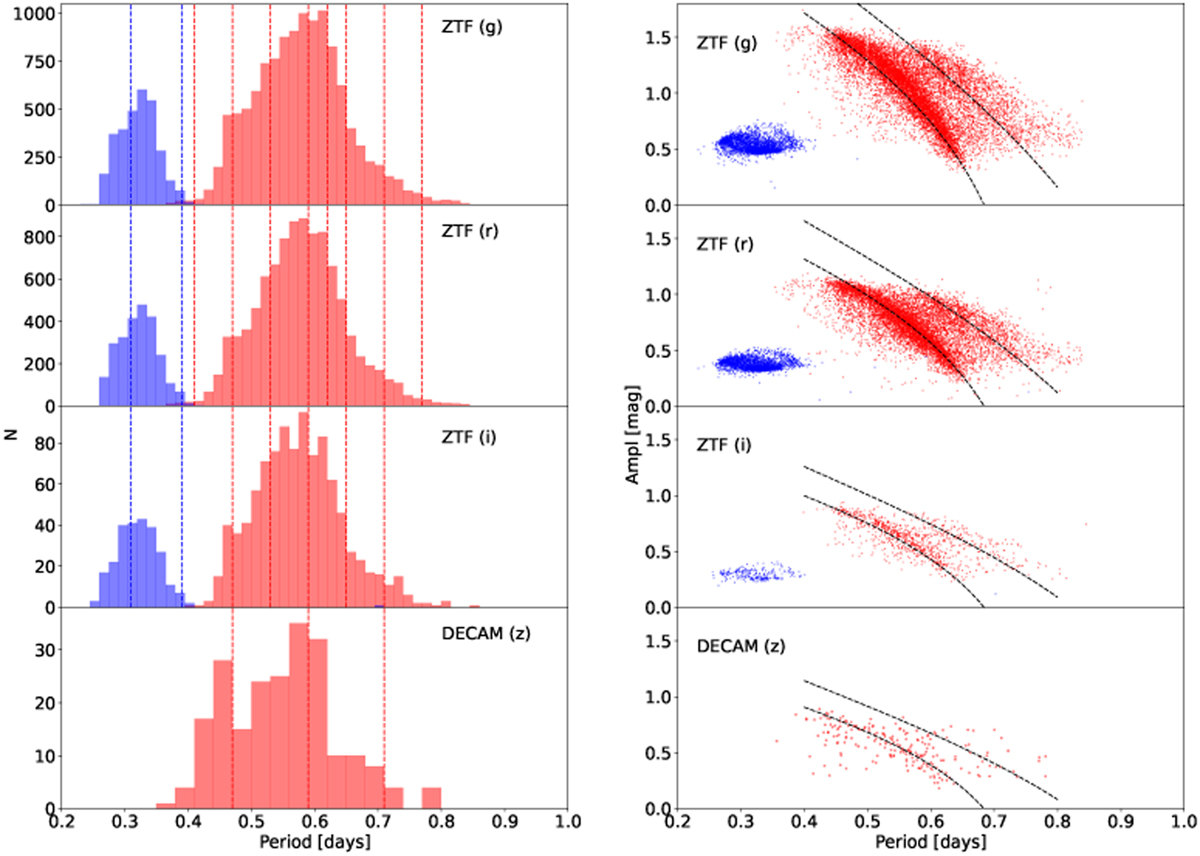
Period distributions and Bailey diagrams of our ZTF and DECAM RRLs. Left panels, from top to bottom: period distribution of the RRLs adopted to build the templates in the 𝑔ZrZiZzD bands. The RRab are displayed in red and RRc in blue. The red and blue dashed lines display the period thresholds of the LCTs derived in this work, for RRab and RRc, respectively. Right panels: same as left but for the Bailey diagram (period versus Ampl). Dashed black lines display the loci of the Oosterhoff tracks derived by Fabrizio et al. (2019) and transformed into the 𝑔ZrZiZzD bands using the ratios derived in Appendix D.
Current usage metrics show cumulative count of Article Views (full-text article views including HTML views, PDF and ePub downloads, according to the available data) and Abstracts Views on Vision4Press platform.
Data correspond to usage on the plateform after 2015. The current usage metrics is available 48-96 hours after online publication and is updated daily on week days.
Initial download of the metrics may take a while.