Fig. 5
Download original image
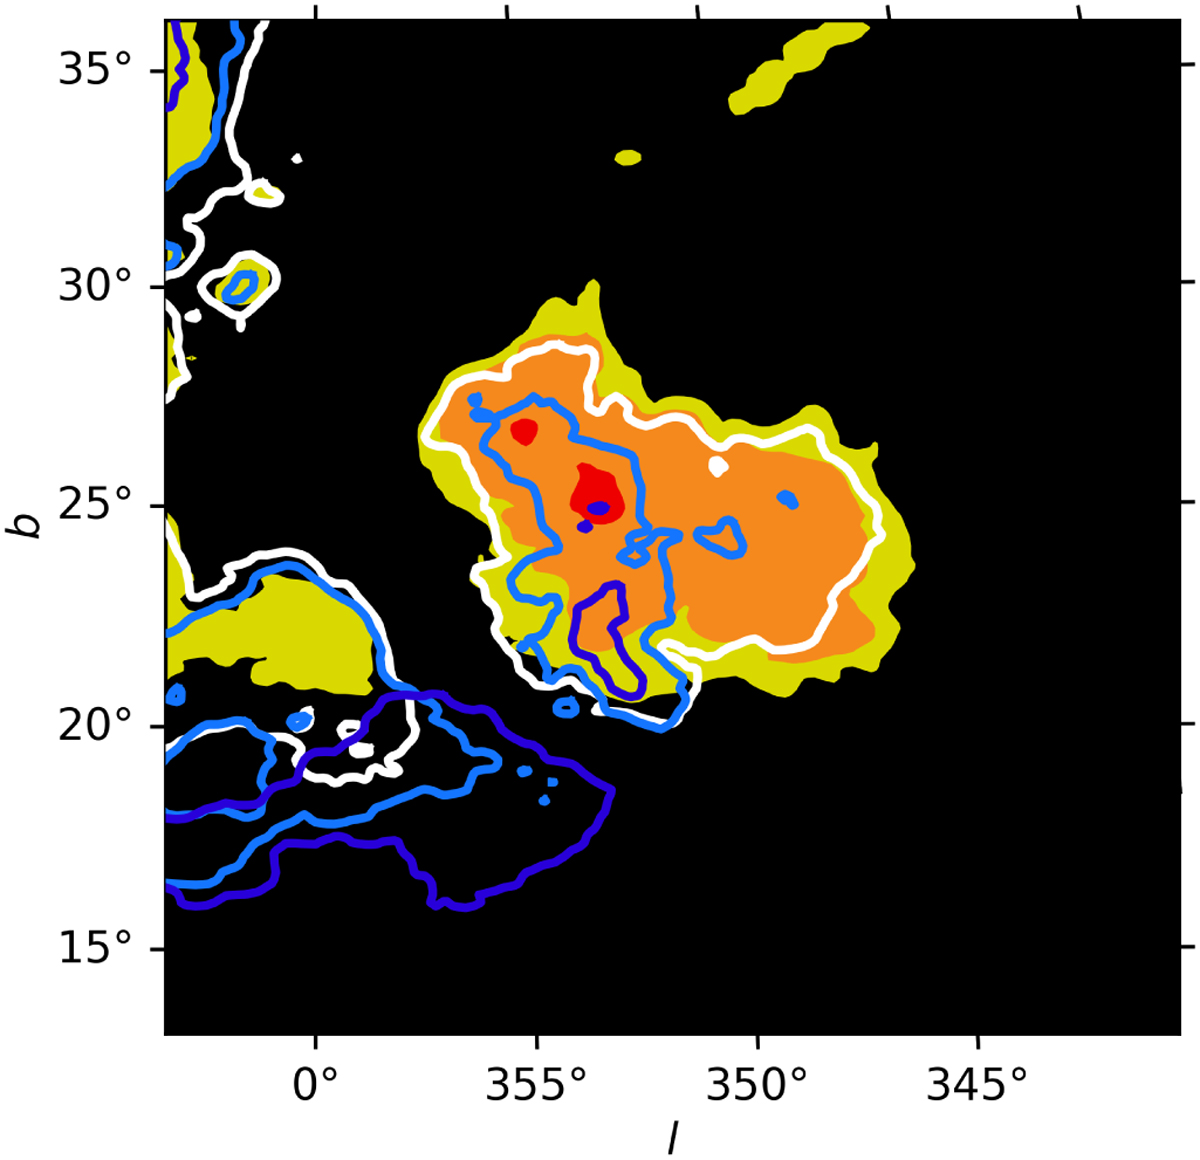
Slices of the dust map from Edenhofer et al. (2024) at six different distances in the area of the H I cloud (same as Fig. 4). The contours represent AV = 9 mmag pc−1. The foreground regions at 95 pc, 100 pc, and 105 pc are displayed as filled contours in red, orange, and yellow, respectively. The background regions at 110 pc, 115 pc and 120 pc are presented as white, blue, and dark blue contour lines, respectively.
Current usage metrics show cumulative count of Article Views (full-text article views including HTML views, PDF and ePub downloads, according to the available data) and Abstracts Views on Vision4Press platform.
Data correspond to usage on the plateform after 2015. The current usage metrics is available 48-96 hours after online publication and is updated daily on week days.
Initial download of the metrics may take a while.