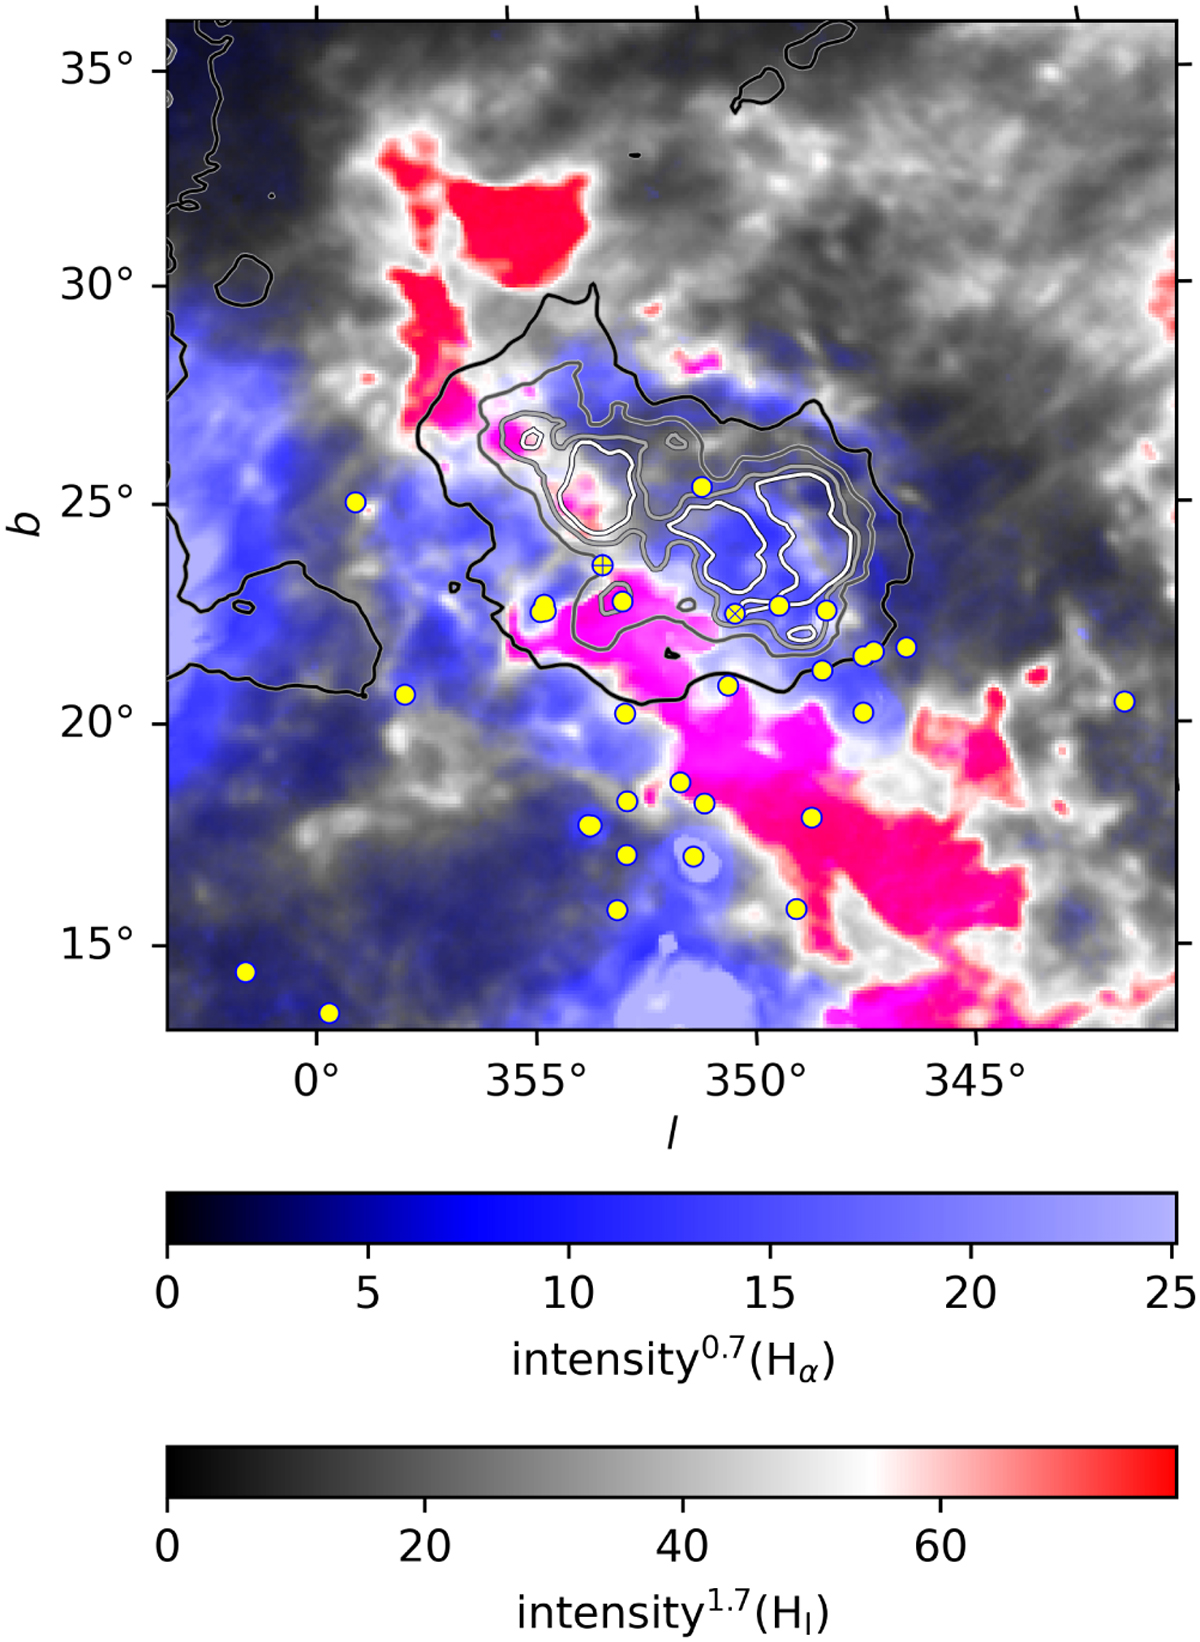
Fig. 4
Download original image
Map of the region around the studied cloud constructed by overlapping the maps in H I (HI4PI Collaboration 2016, −13 km s−1) and H II (Finkbeiner 2003). The default map intensities were re-scaled with the use of a power law (see the colour bars) for a better contrast between the images. The stars used to analyse the spectra of Ca II are displayed as yellow circles; β Sco and δ Sco are marked with a plus and a cross symbol, respectively. Contours of the dust map from Edenhofer et al. (2024) at a distance of 107 pc are also presented (from black to white: AV = 9, 16, 23, and 30 mmag pc−1). To view the same image in different colour maps, see https://github.com/mpiecka/Sco-Cen-outflow-H-I-filament-sky-map.
Current usage metrics show cumulative count of Article Views (full-text article views including HTML views, PDF and ePub downloads, according to the available data) and Abstracts Views on Vision4Press platform.
Data correspond to usage on the plateform after 2015. The current usage metrics is available 48-96 hours after online publication and is updated daily on week days.
Initial download of the metrics may take a while.