Fig. 3
Download original image
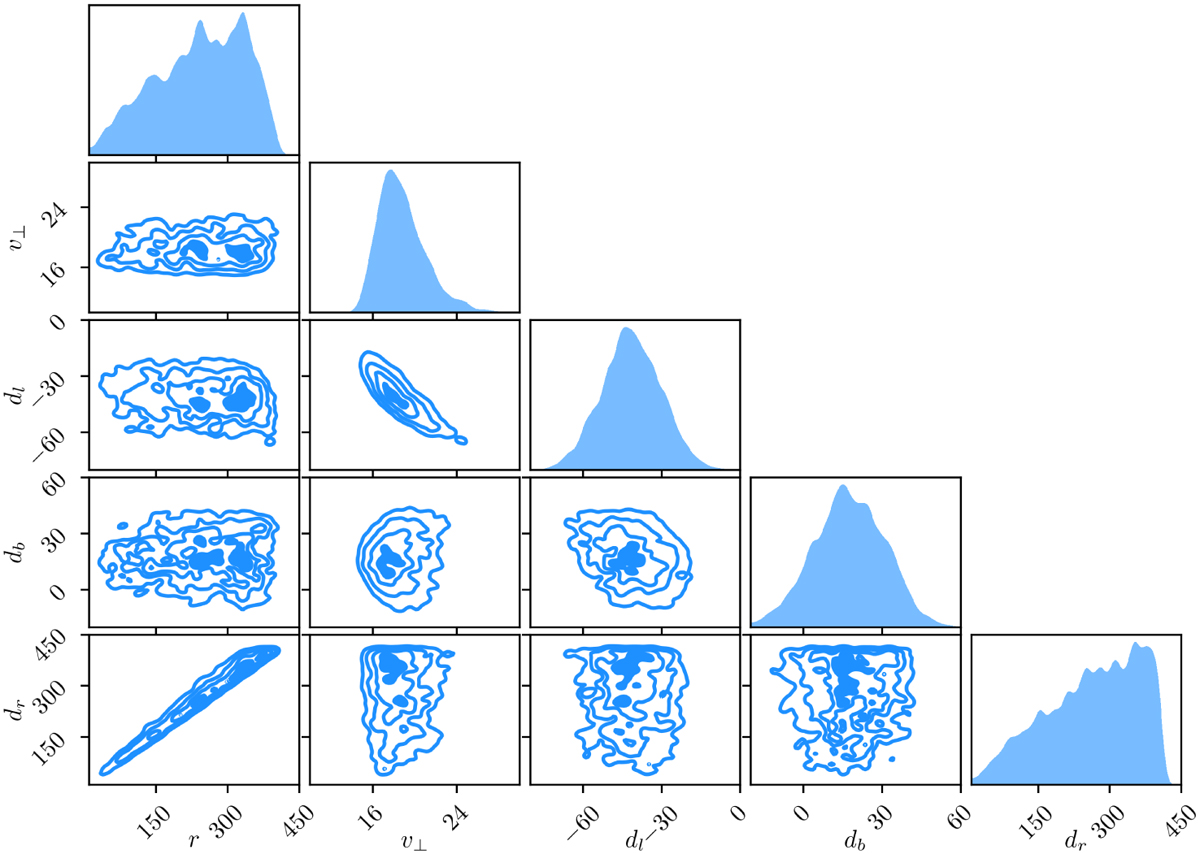
Corner plot illustrating the marginal posteriors of the thin shell model constrained by the Ca II data. The one-to-one correlation between the distance parameter (dr) and the radius parameter (r) is clearly seen in the bottom-left corner. It suggests that a single-component spherical flow model cannot explain the observed data and that the model locally approaches (in the limit) a constant flow.
Current usage metrics show cumulative count of Article Views (full-text article views including HTML views, PDF and ePub downloads, according to the available data) and Abstracts Views on Vision4Press platform.
Data correspond to usage on the plateform after 2015. The current usage metrics is available 48-96 hours after online publication and is updated daily on week days.
Initial download of the metrics may take a while.