Fig. 2
Download original image
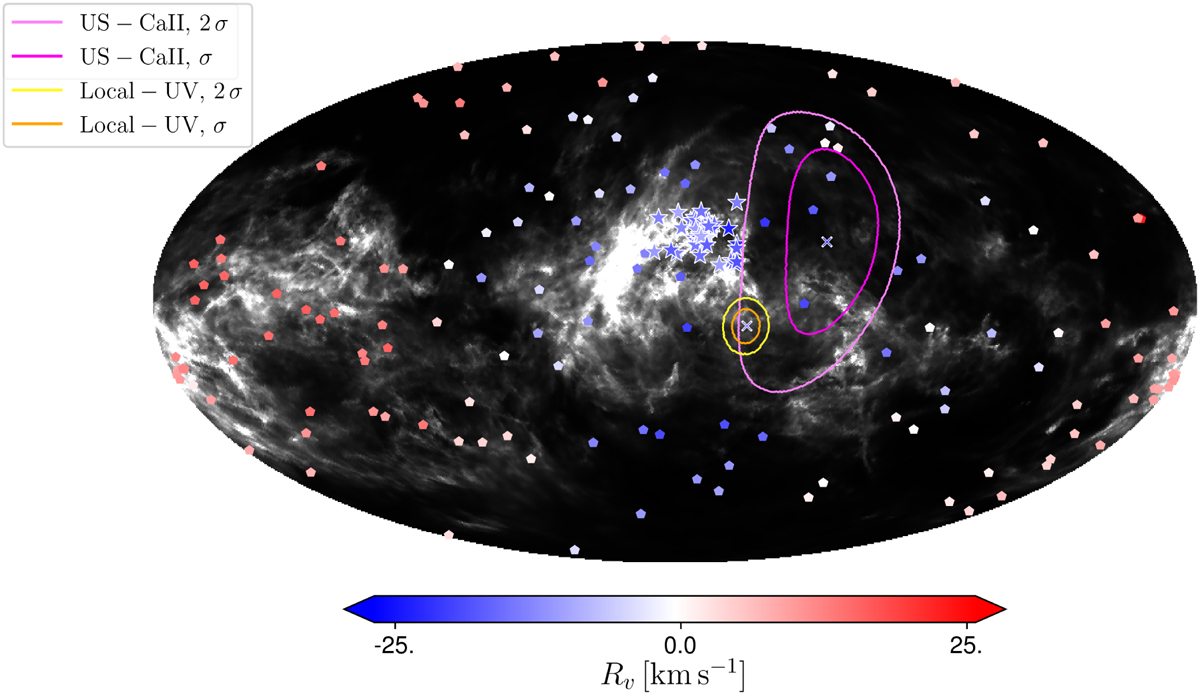
Marginal posterior distributions of the outflow direction in the sky. The image is centred on (l, b) = (0°, 0°). We show the contours of the 1 and 2 σ quantiles: orange-yellow colours for Ca II and magenta colours for the local flow data from Redfield & Linsky (2008). We highlight the respective posterior means with large blue cross symbols. The positions of the stars are shown as pentagons (local flow) and stars (Ca II), with the amplitude of the RV of both data and posterior mean indicated by the blue-red colour map. The background grey-scale shows the Edenhofer et al. (2024) dust map, integrated up to 400 pc.
Current usage metrics show cumulative count of Article Views (full-text article views including HTML views, PDF and ePub downloads, according to the available data) and Abstracts Views on Vision4Press platform.
Data correspond to usage on the plateform after 2015. The current usage metrics is available 48-96 hours after online publication and is updated daily on week days.
Initial download of the metrics may take a while.