Fig. 1
Download original image
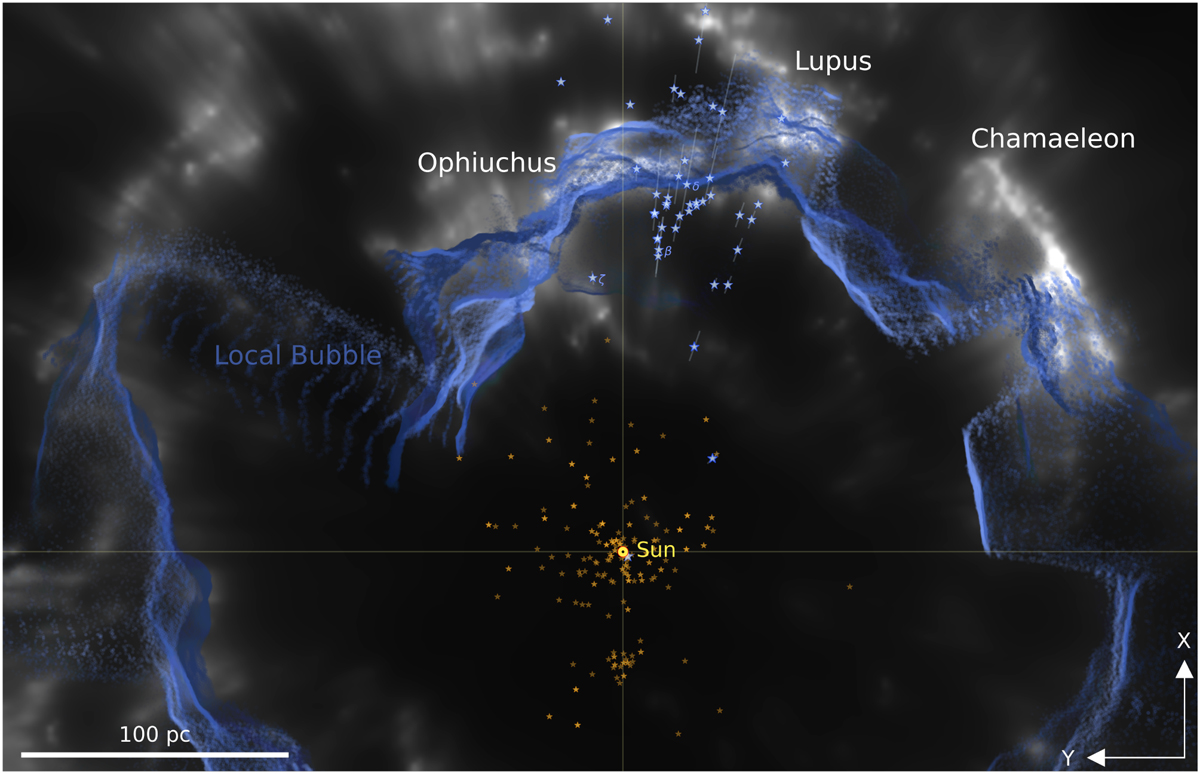
Map of the studied region between the Sun and Sco-Cen. The grey-shaded areas represent the dust map from Edenhofer et al. (2024) projected onto the XY-plane; the blue-shaded areas (brighter closer to the Galactic plane) show the Local Bubble map (−50 < Z < 50 pc; O’Neill et al. 2024) based on the same dust map. The orange stars show the positions of the objects from Redfield & Linsky (2008); brighter orange stars represent measurements with multiple velocity components. The larger blue stars indicate the positions (d = ϖ−1) of our calcium-probing (mostly B-type) stars, with lines indicating distance uncertainties. The two arrows in the bottom-right corner show the directions towards the Galactic centre (up) and the Galactic rotation (left). The bar in the bottom-left corner (length of 100 pc) serves as a distance scale.
Current usage metrics show cumulative count of Article Views (full-text article views including HTML views, PDF and ePub downloads, according to the available data) and Abstracts Views on Vision4Press platform.
Data correspond to usage on the plateform after 2015. The current usage metrics is available 48-96 hours after online publication and is updated daily on week days.
Initial download of the metrics may take a while.