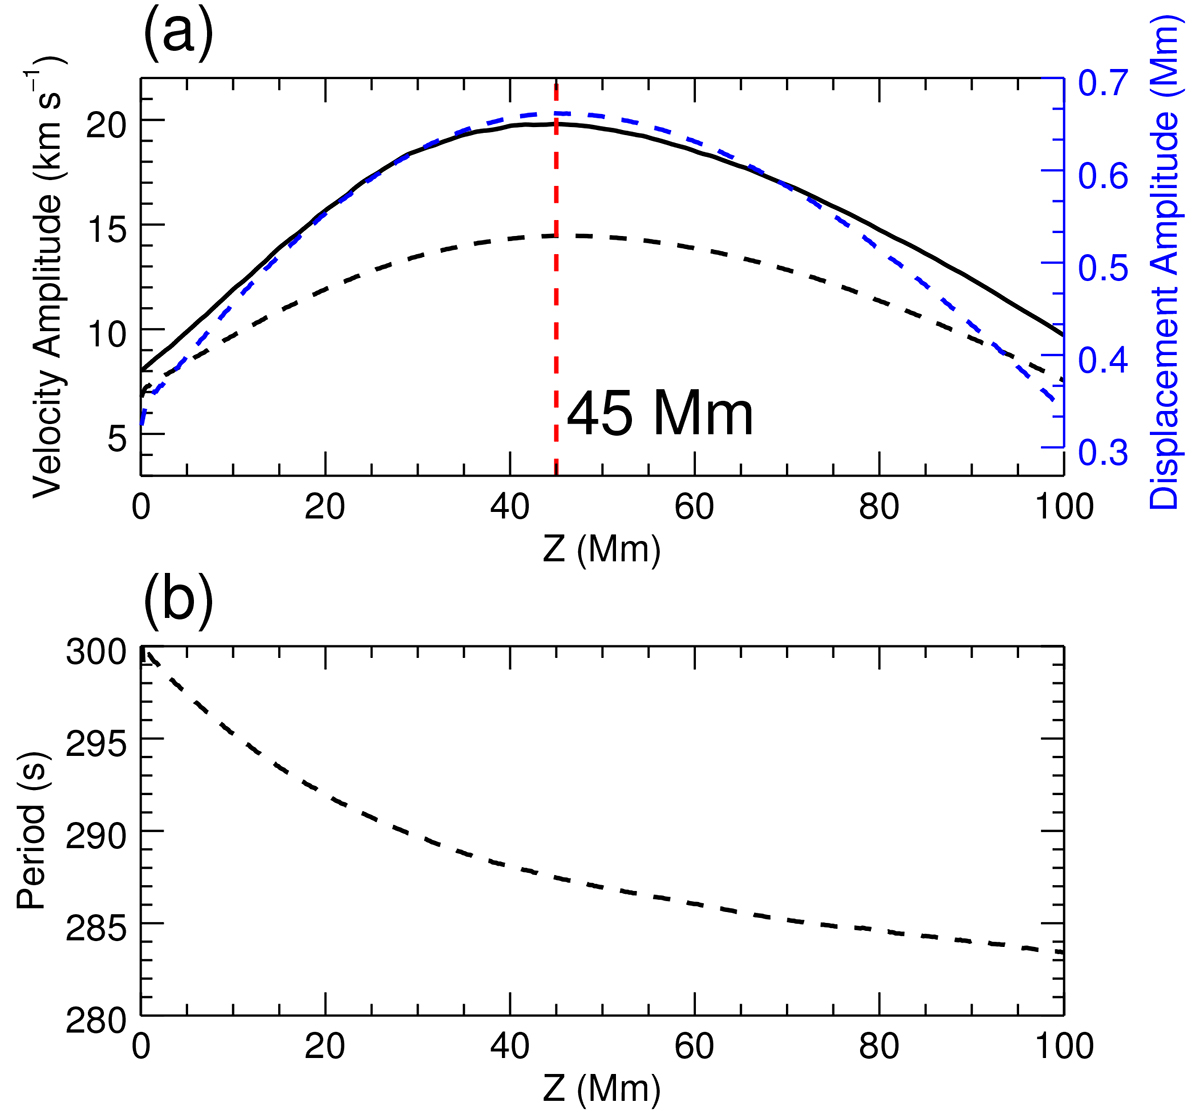
Fig. 9.
Download original image
Height variation in the wave parameters. (a) Height variation in the velocity (black) and displacement (blue) amplitude, with the dashed red line indicating the position where the amplitude reaches the maximum (z = 45 Mm). (b) Height variation in the wave period. The solid black line is extracted from the original simulation output data, and all other dashed lines in both panels are obtained with forward modelling results as described in Section 4.3.
Current usage metrics show cumulative count of Article Views (full-text article views including HTML views, PDF and ePub downloads, according to the available data) and Abstracts Views on Vision4Press platform.
Data correspond to usage on the plateform after 2015. The current usage metrics is available 48-96 hours after online publication and is updated daily on week days.
Initial download of the metrics may take a while.