Fig. 8.
Download original image
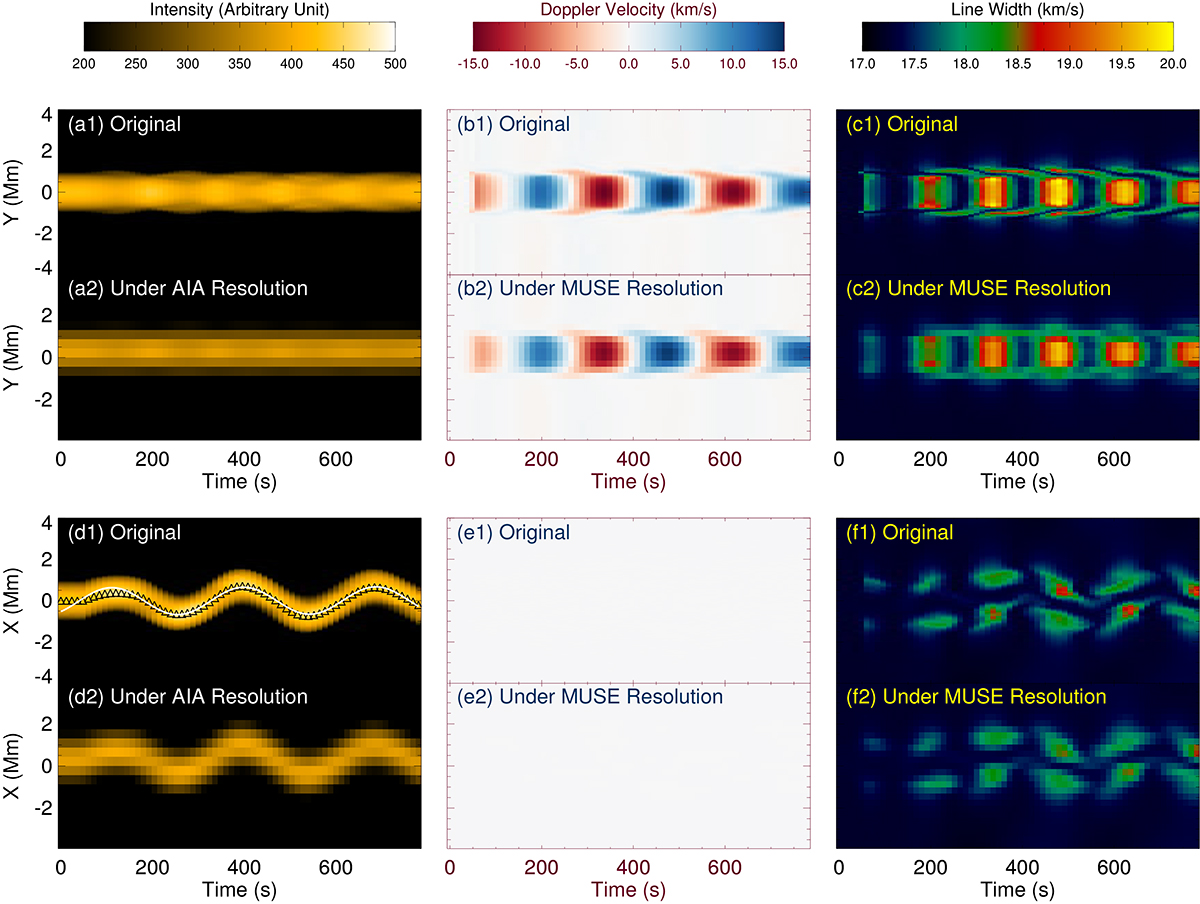
TD maps of forward modelling results at z = 40 Mm. The upper and lower rows correspond to the LOS view and POS view (defined in Section 4), respectively. (a) TD maps of the Fe IX 17.1 nm line intensity with the original spatial resolution and a degraded resolution comparable to AIA. (b) and (c) TD maps of the Doppler velocity and line width with the original spatial resolution and a degraded resolution comparable to that of MUSE. Panels d–f: same but for the POS view. Panel d1: demonstrates how we obtained the wave parameters from the intensity TD maps. The tube centre positions are marked with black triangles, and the sinusoidal fitting results are depicted with a white curve.
Current usage metrics show cumulative count of Article Views (full-text article views including HTML views, PDF and ePub downloads, according to the available data) and Abstracts Views on Vision4Press platform.
Data correspond to usage on the plateform after 2015. The current usage metrics is available 48-96 hours after online publication and is updated daily on week days.
Initial download of the metrics may take a while.