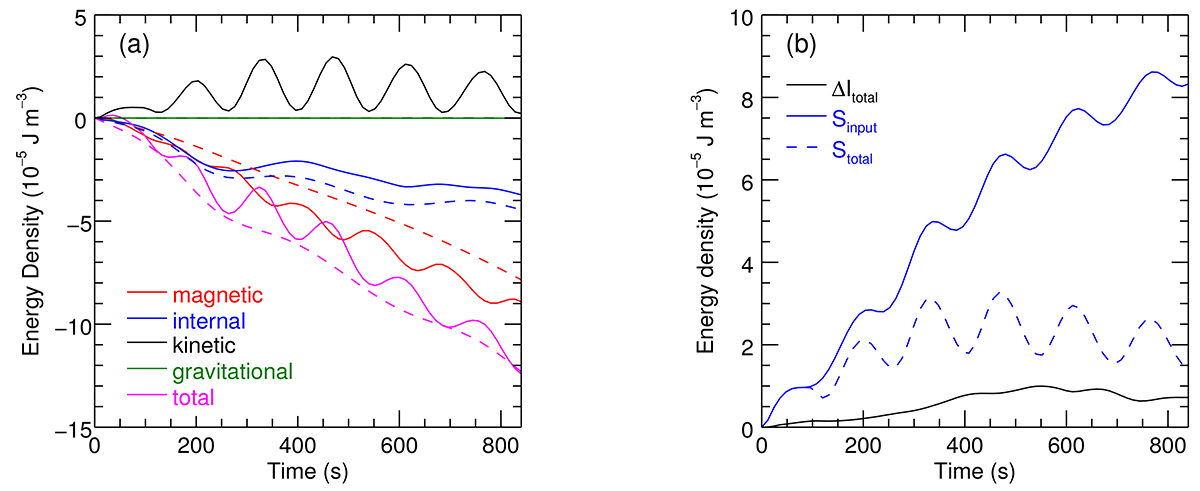
Fig. 7.
Download original image
Results of the energy analysis. (a) Time series for the magnetic (red), internal (blue), kinetic (black), gravitational (green), and total (magenta) energy density relative to t = 0. Solid and dashed lines represent simulation runs with and without a wave driver, respectively. (b) Time series of increased internal energy due to wave energy (ΔItotal, the solid black line), total input energy from the wave driver (Sinput, the solid blue line), and the ‘trapped’ portion of input energy (Stotal, the dashed blue line).
Current usage metrics show cumulative count of Article Views (full-text article views including HTML views, PDF and ePub downloads, according to the available data) and Abstracts Views on Vision4Press platform.
Data correspond to usage on the plateform after 2015. The current usage metrics is available 48-96 hours after online publication and is updated daily on week days.
Initial download of the metrics may take a while.