Fig. 6.
Download original image
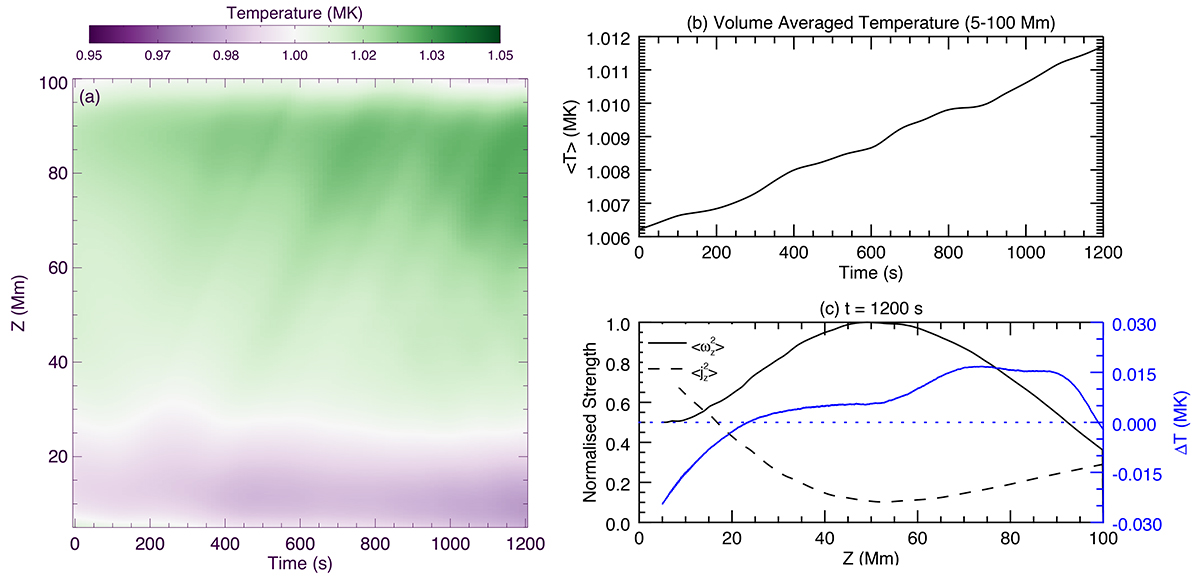
Temperature changes in the simulation. (a) Temporal and height variations in the surface-averaged temperature. (b) Time series of the volume-averaged temperature within [−2, 2] Mm × [−2, 2] Mm × [5, 100] Mm. (c) The solid and dashed black lines depict the height dependence of normalised ![]() and
and ![]() , respectively, which are averaged at each height over the time range from t = 0 to 1200 s. The solid blue line represents the increase in surface-averaged temperature (ΔT) relative to t = 0 as a function of heights, with the dotted blue line corresponding to ΔT = 0.
, respectively, which are averaged at each height over the time range from t = 0 to 1200 s. The solid blue line represents the increase in surface-averaged temperature (ΔT) relative to t = 0 as a function of heights, with the dotted blue line corresponding to ΔT = 0.
Current usage metrics show cumulative count of Article Views (full-text article views including HTML views, PDF and ePub downloads, according to the available data) and Abstracts Views on Vision4Press platform.
Data correspond to usage on the plateform after 2015. The current usage metrics is available 48-96 hours after online publication and is updated daily on week days.
Initial download of the metrics may take a while.