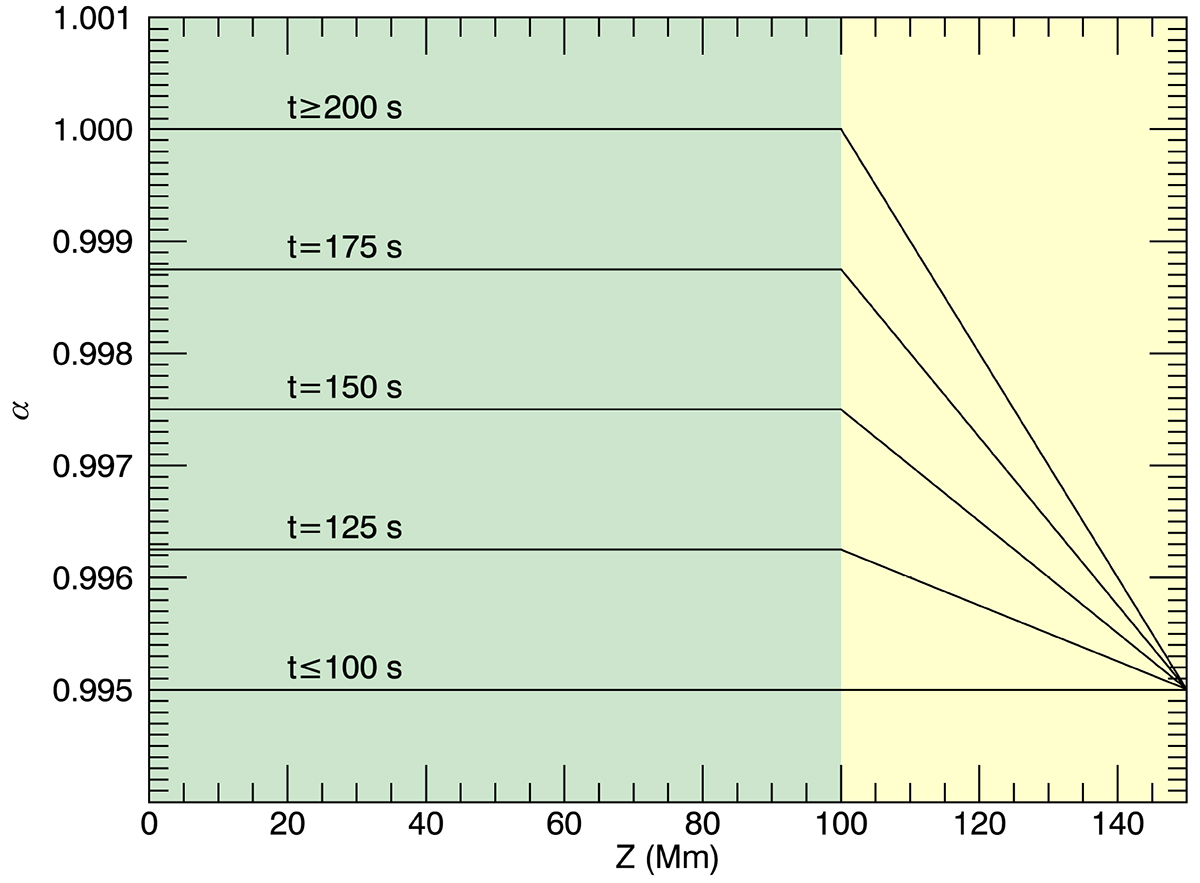
Fig. 2.
Download original image
Dependence of the velocity absorption factor, α, on height (z, horizontal axis) and time (indicated by different lines). Green and yellow shading distinguishes the regions below and above 100 Mm. The latter can be regarded as an extended upper boundary, and we only analysed and discuss the results below 100 Mm (green shading).
Current usage metrics show cumulative count of Article Views (full-text article views including HTML views, PDF and ePub downloads, according to the available data) and Abstracts Views on Vision4Press platform.
Data correspond to usage on the plateform after 2015. The current usage metrics is available 48-96 hours after online publication and is updated daily on week days.
Initial download of the metrics may take a while.