Fig. 10.
Download original image
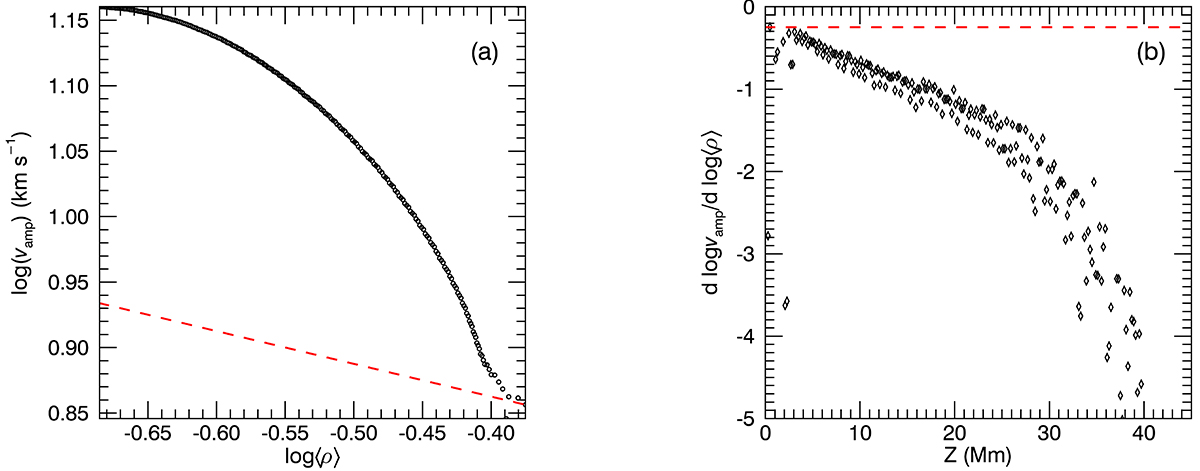
Assessment of the seismology techniques used in previous studies (see Section 5.1). (a) Scatter plot between log⟨ρ⟩ and log vamp. The dashed red line indicates their theoretical relation with a slope of −1/4 based on Equation (16). (b) Derivative dlog vamp/dlog⟨ρ⟩ as a function of height (z). The theoretical value (−1/4) based on Equation (16) is also depicted with the dashed red line. We note that in panel a, the height decreases from left to right.
Current usage metrics show cumulative count of Article Views (full-text article views including HTML views, PDF and ePub downloads, according to the available data) and Abstracts Views on Vision4Press platform.
Data correspond to usage on the plateform after 2015. The current usage metrics is available 48-96 hours after online publication and is updated daily on week days.
Initial download of the metrics may take a while.