Fig. 1.
Download original image
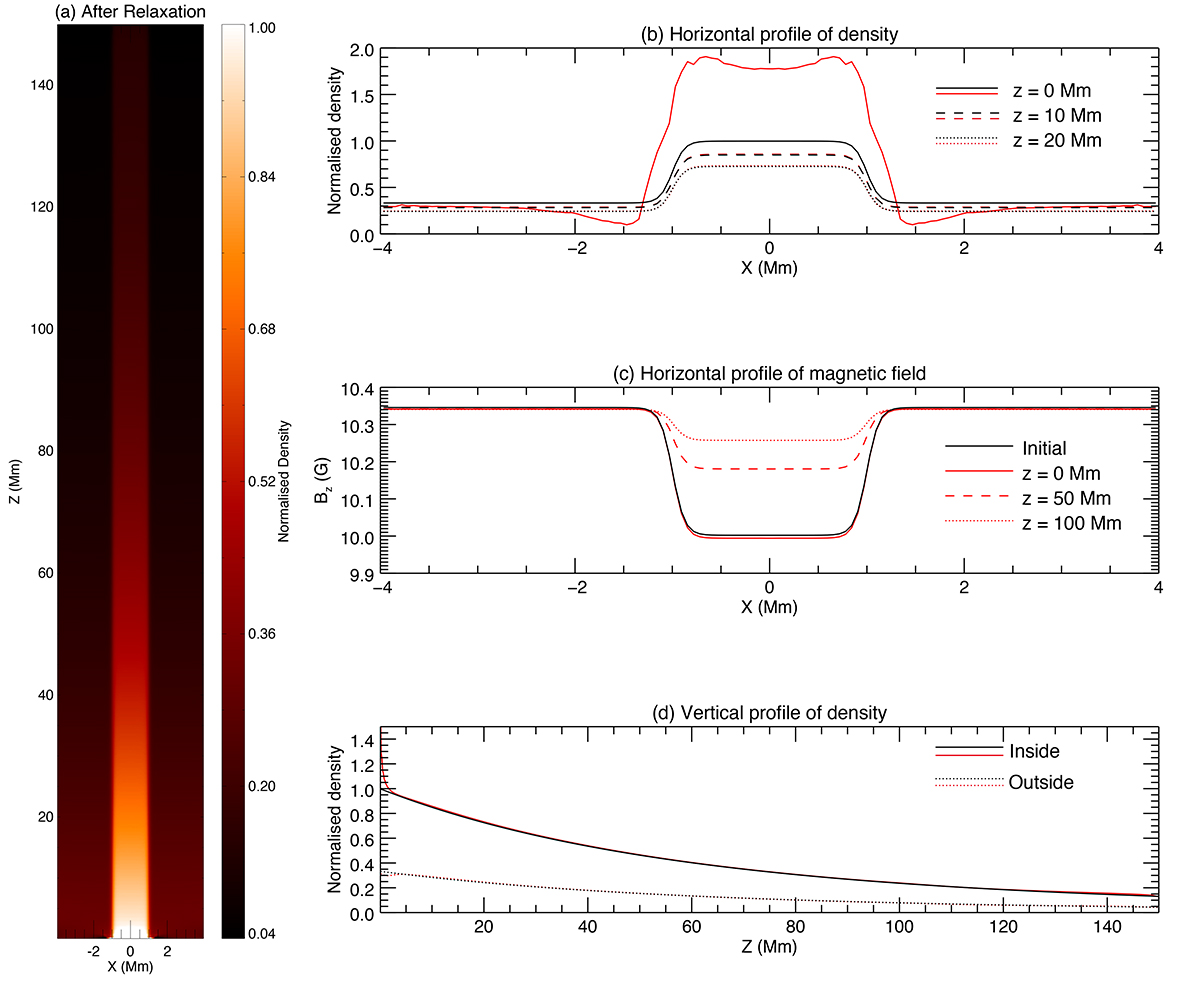
Illustration of the model setup. (a) Density distribution at the y = 0 plane after relaxation. (b) and (c) Horizontal profiles of the density and magnetic field along the x axis at three different heights (indicated by different line styles). (d) Vertical profile of the density, demonstrating gravitational stratification, with solid and dashed lines indicating density within and outside the flux tube, respectively. The black and red lines in panels b–d represent states before and after relaxation, respectively. We note that the magnetic field in the initial state (before relaxation) is uniform along the z axis, and hence there is only one black line in panel c.
Current usage metrics show cumulative count of Article Views (full-text article views including HTML views, PDF and ePub downloads, according to the available data) and Abstracts Views on Vision4Press platform.
Data correspond to usage on the plateform after 2015. The current usage metrics is available 48-96 hours after online publication and is updated daily on week days.
Initial download of the metrics may take a while.