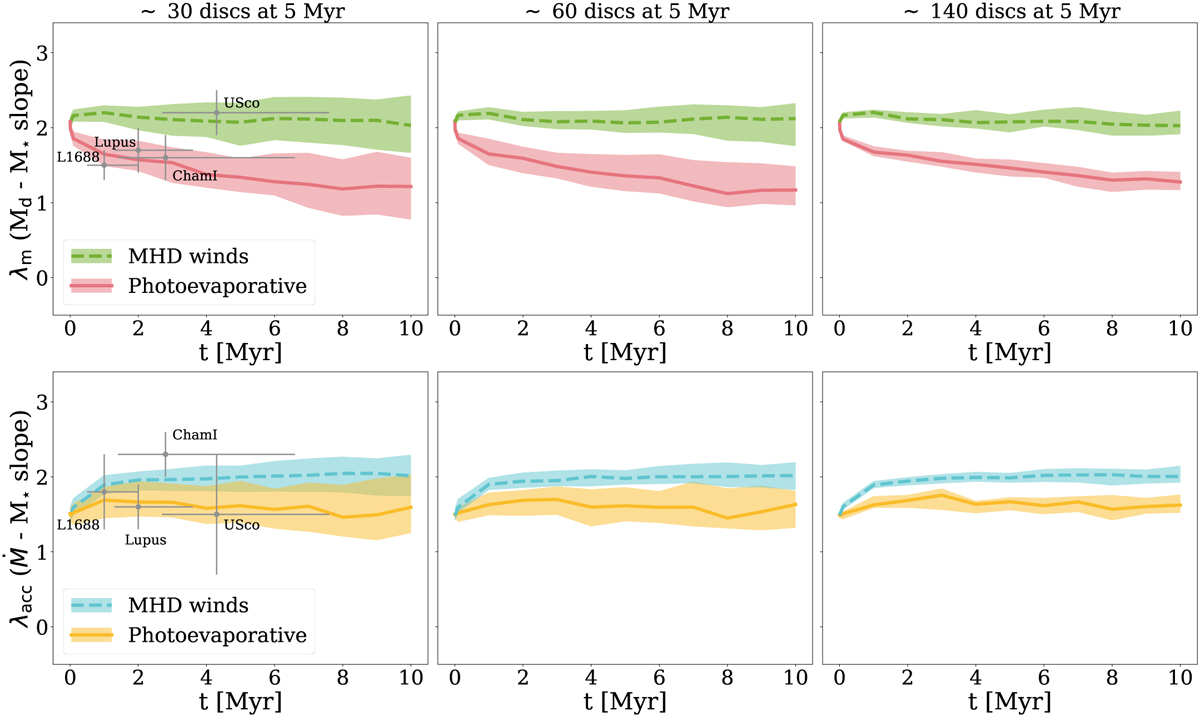
Fig. 5
Download original image
Comparison of the time evolution of λm (top) and λacc (bottom) between the viscous+photoevaporative and wind-driven case including measured slopes from four star-forming regions. To account for statistical fluctuations, each simulation combines 100 realisations of the same initial conditions: the lines show the median evolution, while the shaded area represent the interval between the 25th and 75th percentiles. The simulations in the three columns differ for the initial number of discs, determined to obtain a specific sample size at 5 Myr − currently available sample (left), double the currently available sample (centre) and the complete sample (right). Observed slopes from Testi et al. (2022).
Current usage metrics show cumulative count of Article Views (full-text article views including HTML views, PDF and ePub downloads, according to the available data) and Abstracts Views on Vision4Press platform.
Data correspond to usage on the plateform after 2015. The current usage metrics is available 48-96 hours after online publication and is updated daily on week days.
Initial download of the metrics may take a while.