Fig. 2
Download original image
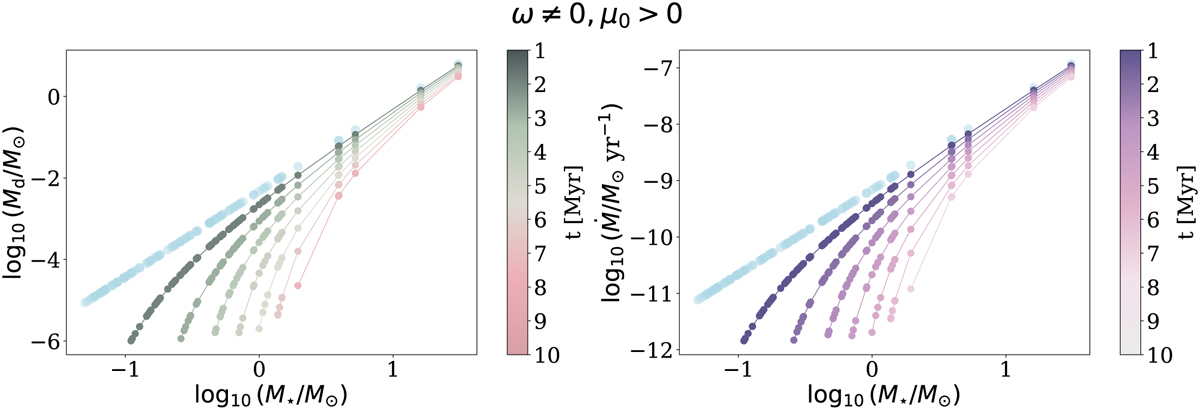
Time evolution of Md–M* (left) and ![]() (right) in the pure wind model (ω ≠ 0). This plot is obtained with disc population synthesis modelling, without any spread in the initial conditions. Each dot represents a disc in the population at different ages as shown in the colour bar. The initial power-law correlation, shown in light blue, is lost as early as ~1 Myr (corresponding to ~2 < tacc,0 > with these parameters) due to a downward bending corresponding to lower stellar masses. In this simulation, we have used N = 100 discs, αDW = 10−3, λ = 3, ω = 0.25, λm,0 = 2.1, λacc,0 = 1.5. The set of MHD parameters is based on Tabone et al. (2022a).
(right) in the pure wind model (ω ≠ 0). This plot is obtained with disc population synthesis modelling, without any spread in the initial conditions. Each dot represents a disc in the population at different ages as shown in the colour bar. The initial power-law correlation, shown in light blue, is lost as early as ~1 Myr (corresponding to ~2 < tacc,0 > with these parameters) due to a downward bending corresponding to lower stellar masses. In this simulation, we have used N = 100 discs, αDW = 10−3, λ = 3, ω = 0.25, λm,0 = 2.1, λacc,0 = 1.5. The set of MHD parameters is based on Tabone et al. (2022a).
Current usage metrics show cumulative count of Article Views (full-text article views including HTML views, PDF and ePub downloads, according to the available data) and Abstracts Views on Vision4Press platform.
Data correspond to usage on the plateform after 2015. The current usage metrics is available 48-96 hours after online publication and is updated daily on week days.
Initial download of the metrics may take a while.