Fig. 9.
Download original image
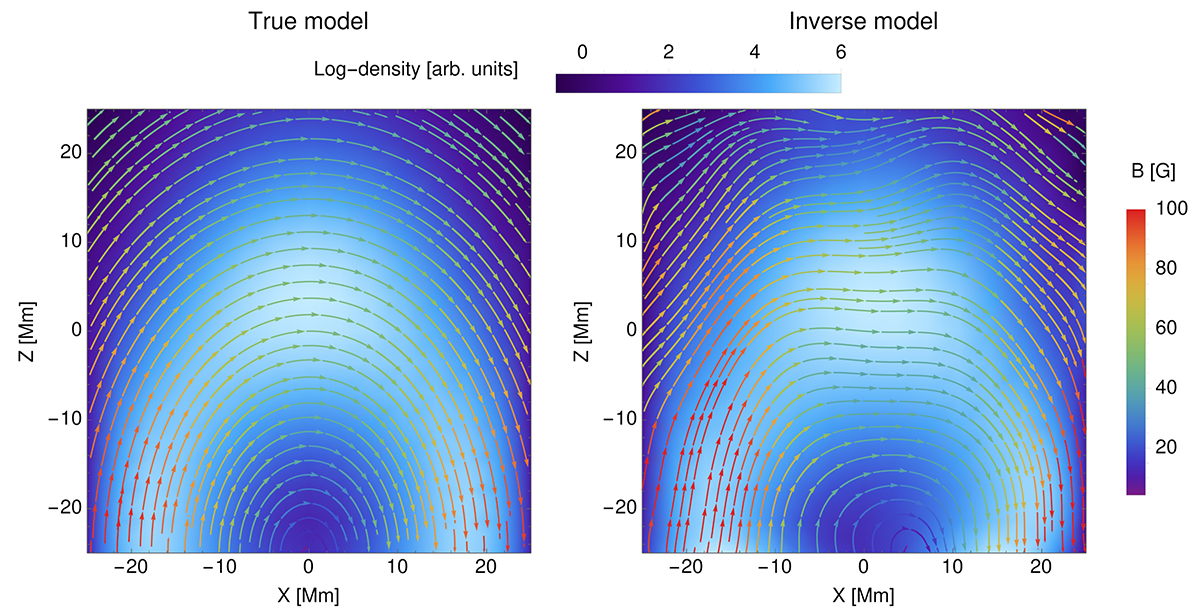
Comparison of vertical slices through the Y = 0 Mm plane in the original model and in the model resulting from the 3D inversion. The left panel shows the magnetic field lines and the density in the original model, and the right panel shows the same quantities in the inferred model. The background color in both panels represents the log-density of Mg II ions. Our 3D Stokes inversion successfully captures the essential morphology of the original model.
Current usage metrics show cumulative count of Article Views (full-text article views including HTML views, PDF and ePub downloads, according to the available data) and Abstracts Views on Vision4Press platform.
Data correspond to usage on the plateform after 2015. The current usage metrics is available 48-96 hours after online publication and is updated daily on week days.
Initial download of the metrics may take a while.