Open Access
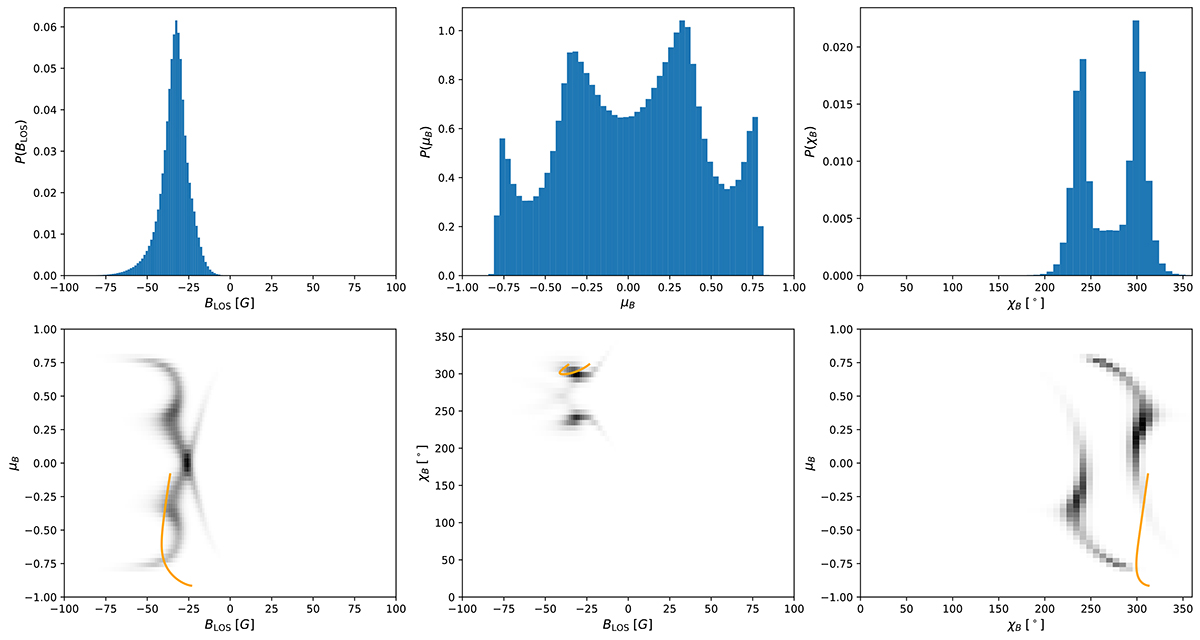
Fig. 7.
Download original image
Marginal posteriors of the Bayesian model parameters. The orange curves in the bottom panels indicate the variation of the actual parameters along the chosen LOS in the spatial domain of the original model. See the main text for details.
Current usage metrics show cumulative count of Article Views (full-text article views including HTML views, PDF and ePub downloads, according to the available data) and Abstracts Views on Vision4Press platform.
Data correspond to usage on the plateform after 2015. The current usage metrics is available 48-96 hours after online publication and is updated daily on week days.
Initial download of the metrics may take a while.