Open Access
Fig. 5.
Download original image
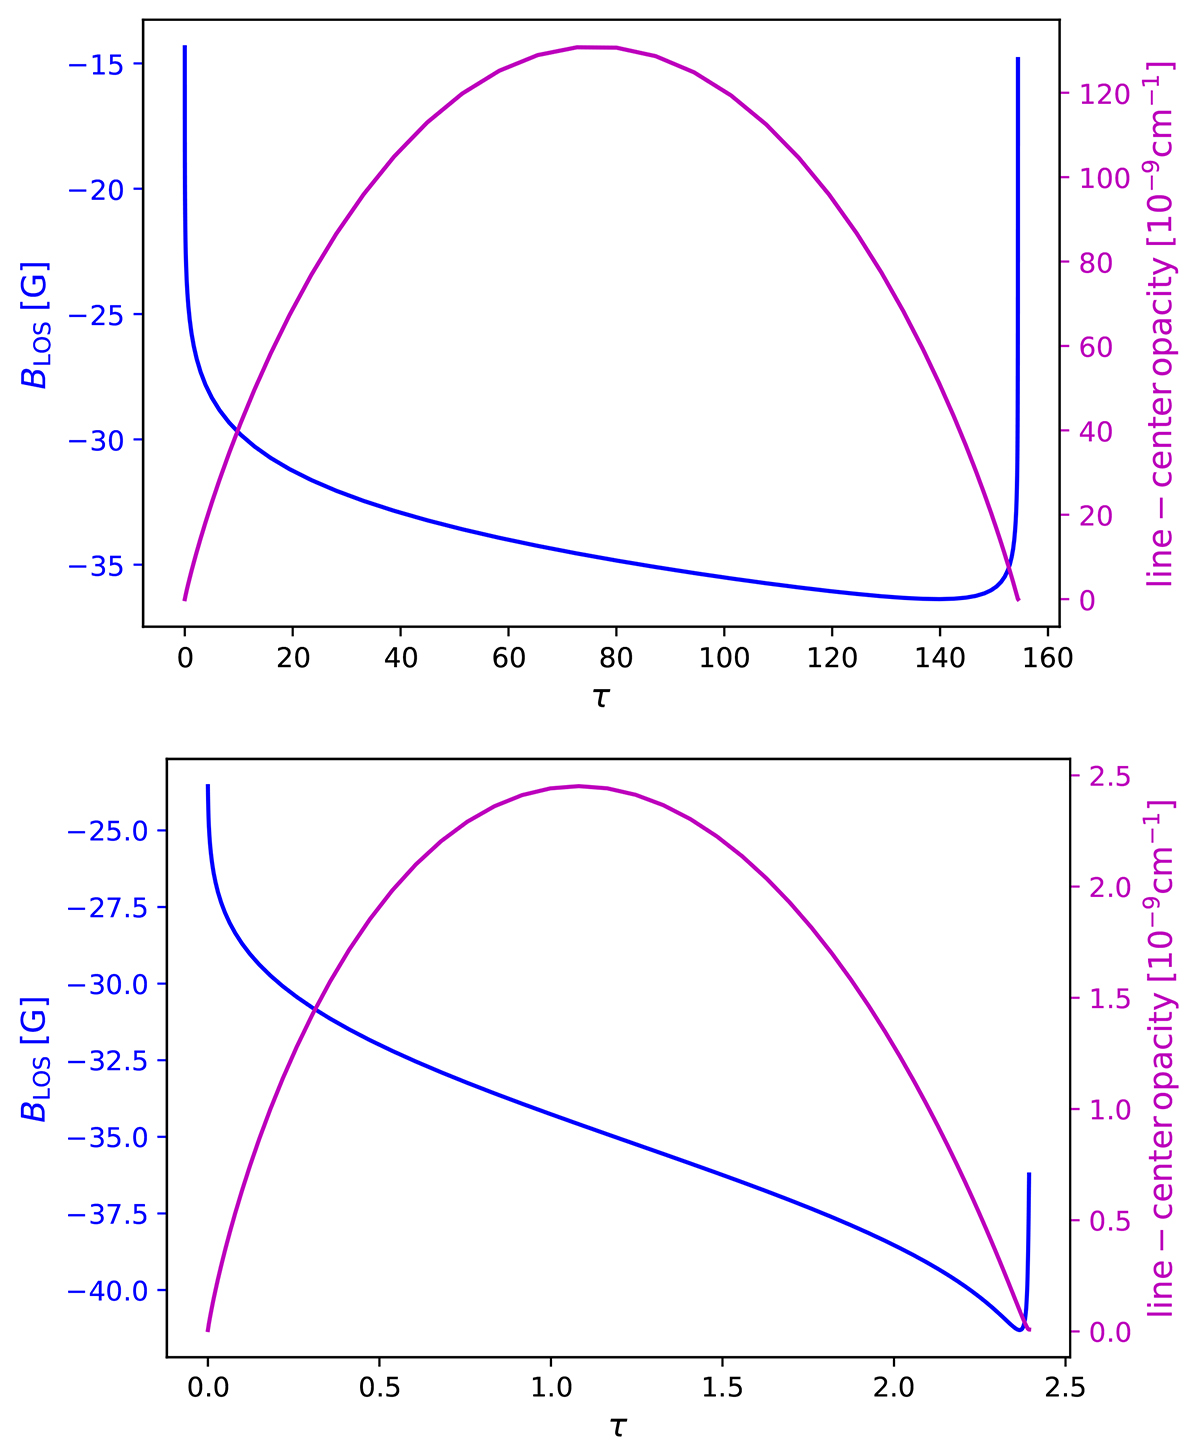
Variation of the LOS component of the magnetic field (blue line) and of the line-center opacity (magenta line) at the black (top panel) and orange (bottom panel) spatial points indicated in Fig. 3. The horizontal axis gives the line-center optical depth along the LOS.
Current usage metrics show cumulative count of Article Views (full-text article views including HTML views, PDF and ePub downloads, according to the available data) and Abstracts Views on Vision4Press platform.
Data correspond to usage on the plateform after 2015. The current usage metrics is available 48-96 hours after online publication and is updated daily on week days.
Initial download of the metrics may take a while.