Fig. 3.
Download original image
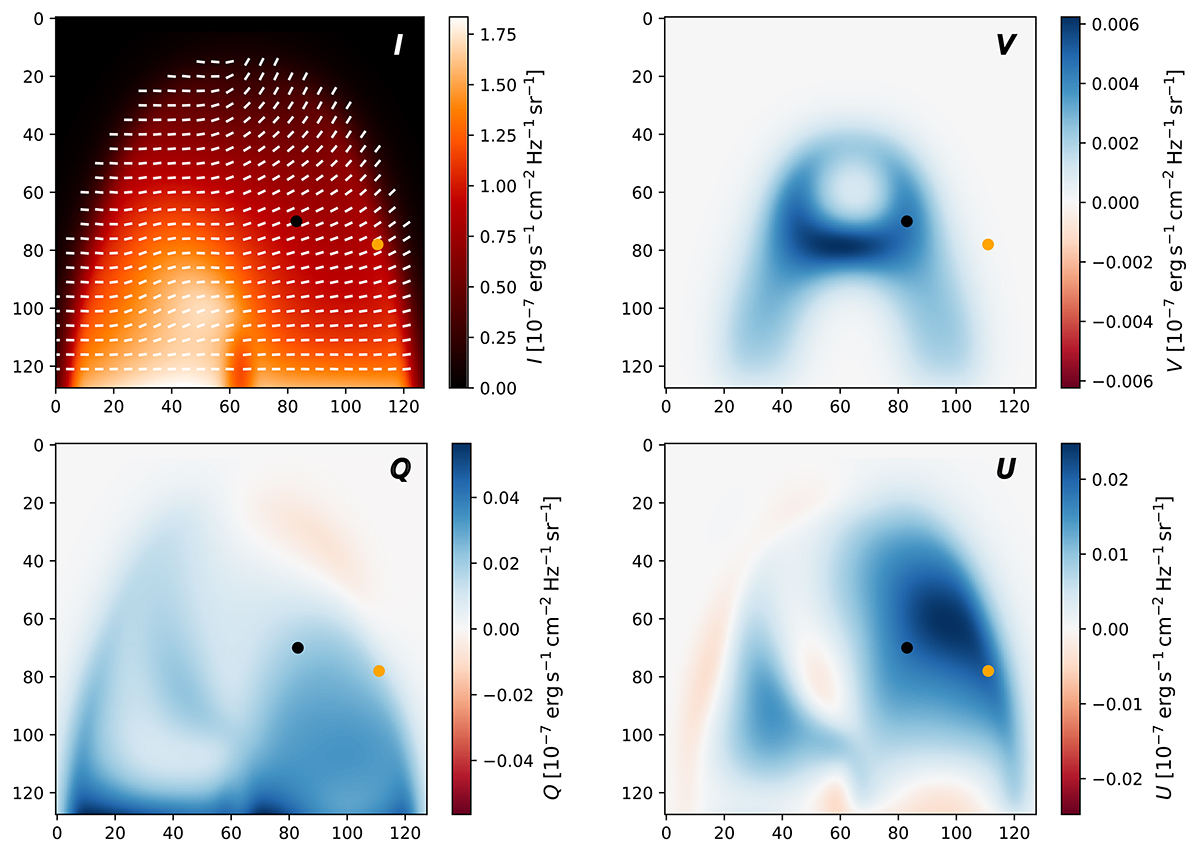
Emergent radiation at each point in the 128 × 128 pixels FOV in the observation as illustrated in the top panel of Fig. 1. The I, Q, and U signals are shown at the line-center wavelength, while the V signal is shown at Δλ = −0.079 Å from the line center. The white vectors in the intensity panel show the orientation of the linear polarization at the line center. The black and orange dots indicate two particular locations in the FOV analyzed in the text.
Current usage metrics show cumulative count of Article Views (full-text article views including HTML views, PDF and ePub downloads, according to the available data) and Abstracts Views on Vision4Press platform.
Data correspond to usage on the plateform after 2015. The current usage metrics is available 48-96 hours after online publication and is updated daily on week days.
Initial download of the metrics may take a while.