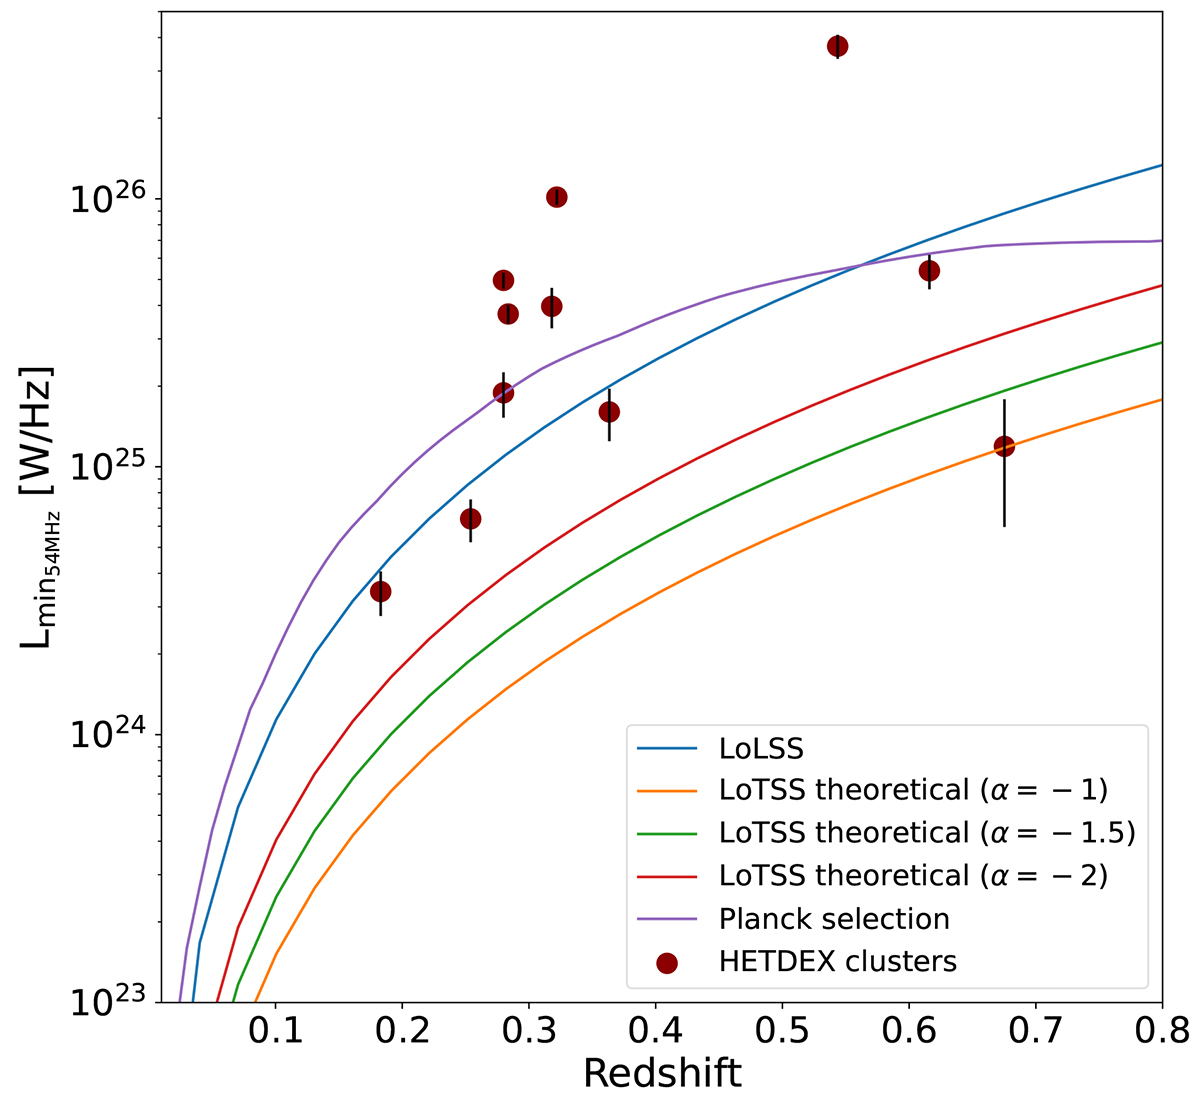
Fig. D.1.
Download original image
Radio power at 54 MHz of radio halos vs. redshift (red circles). The purple curve represents the 50% PSZ2 completeness line converted to 54 MHz radio power following the power-mass correlation of (Cassano et al. 2023) and assuming α = −1.5. The blue curve is the minimum luminosity detectable at 54 MHz by LOFAR following Eq. 2 of (Cassano et al. 2023), estimated assuming re= 150 kpc and a resolution of 100 kpc. The red, green, and yellow curves report instead the minimum luminosity detectable at 144 MHz by LOFAR under the same assumptions, converted to 54 MHz assuming α = −2, −1.5, and −1, respectively.
Current usage metrics show cumulative count of Article Views (full-text article views including HTML views, PDF and ePub downloads, according to the available data) and Abstracts Views on Vision4Press platform.
Data correspond to usage on the plateform after 2015. The current usage metrics is available 48-96 hours after online publication and is updated daily on week days.
Initial download of the metrics may take a while.