Fig. 4
Download original image
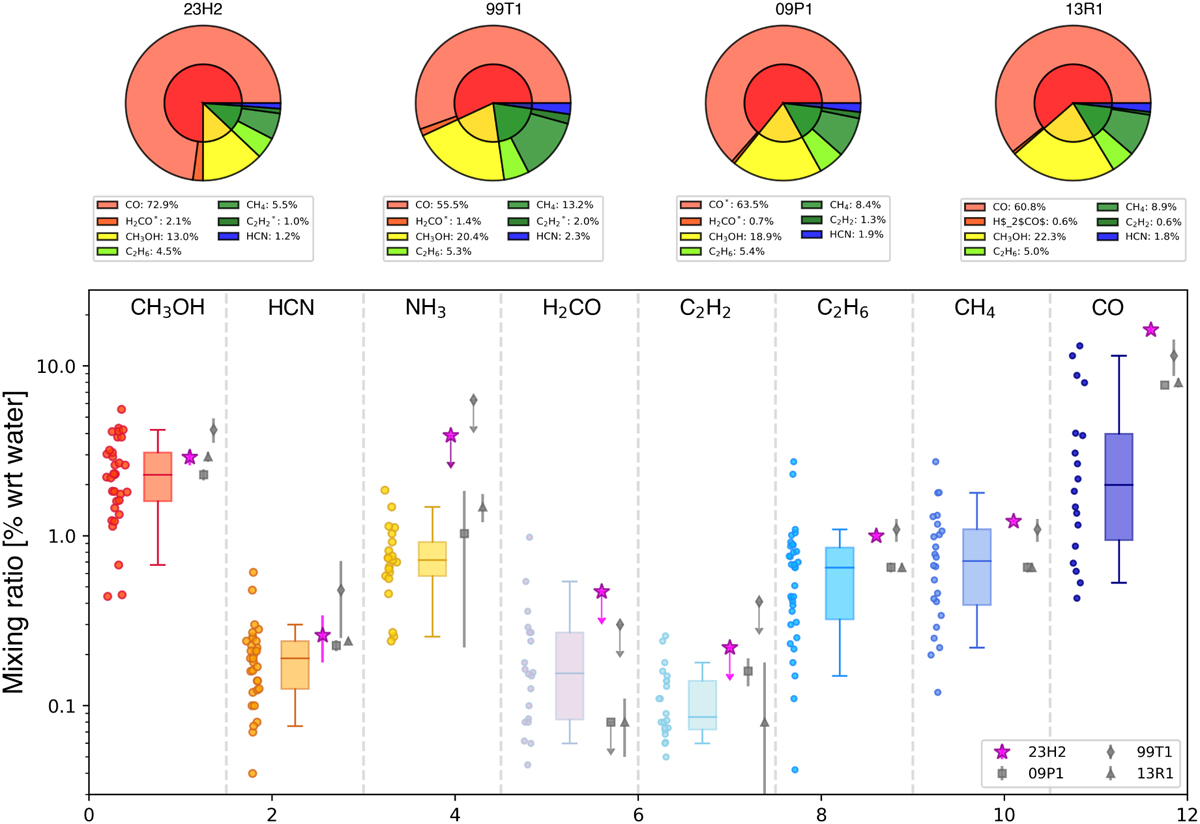
Comparison of C/2023 H2 with other comets. In the upper panel, C/2023 H2 is compared with C/2009P1, C/1999T1, and C/2013 R1, which show the closest relative abundance proportions. In the bottom plot, for each molecular species, we compare C/2023 H2 (marked with a magenta star) with the box plot statistic from other infrared results relative to comets observed within 2 au from the Sun (data are from Lippi et al. 2021 and references therein). For each box the middle line corresponds to the median, the box limits to the 25th and 75th percentiles, and the whiskers to the 5th and 95th percentiles. C/2009P1, C/1999T1, and C/2013 R1 are also shown with a grey square, diamond, and triangle, respectively.
Current usage metrics show cumulative count of Article Views (full-text article views including HTML views, PDF and ePub downloads, according to the available data) and Abstracts Views on Vision4Press platform.
Data correspond to usage on the plateform after 2015. The current usage metrics is available 48-96 hours after online publication and is updated daily on week days.
Initial download of the metrics may take a while.