Fig. 2
Download original image
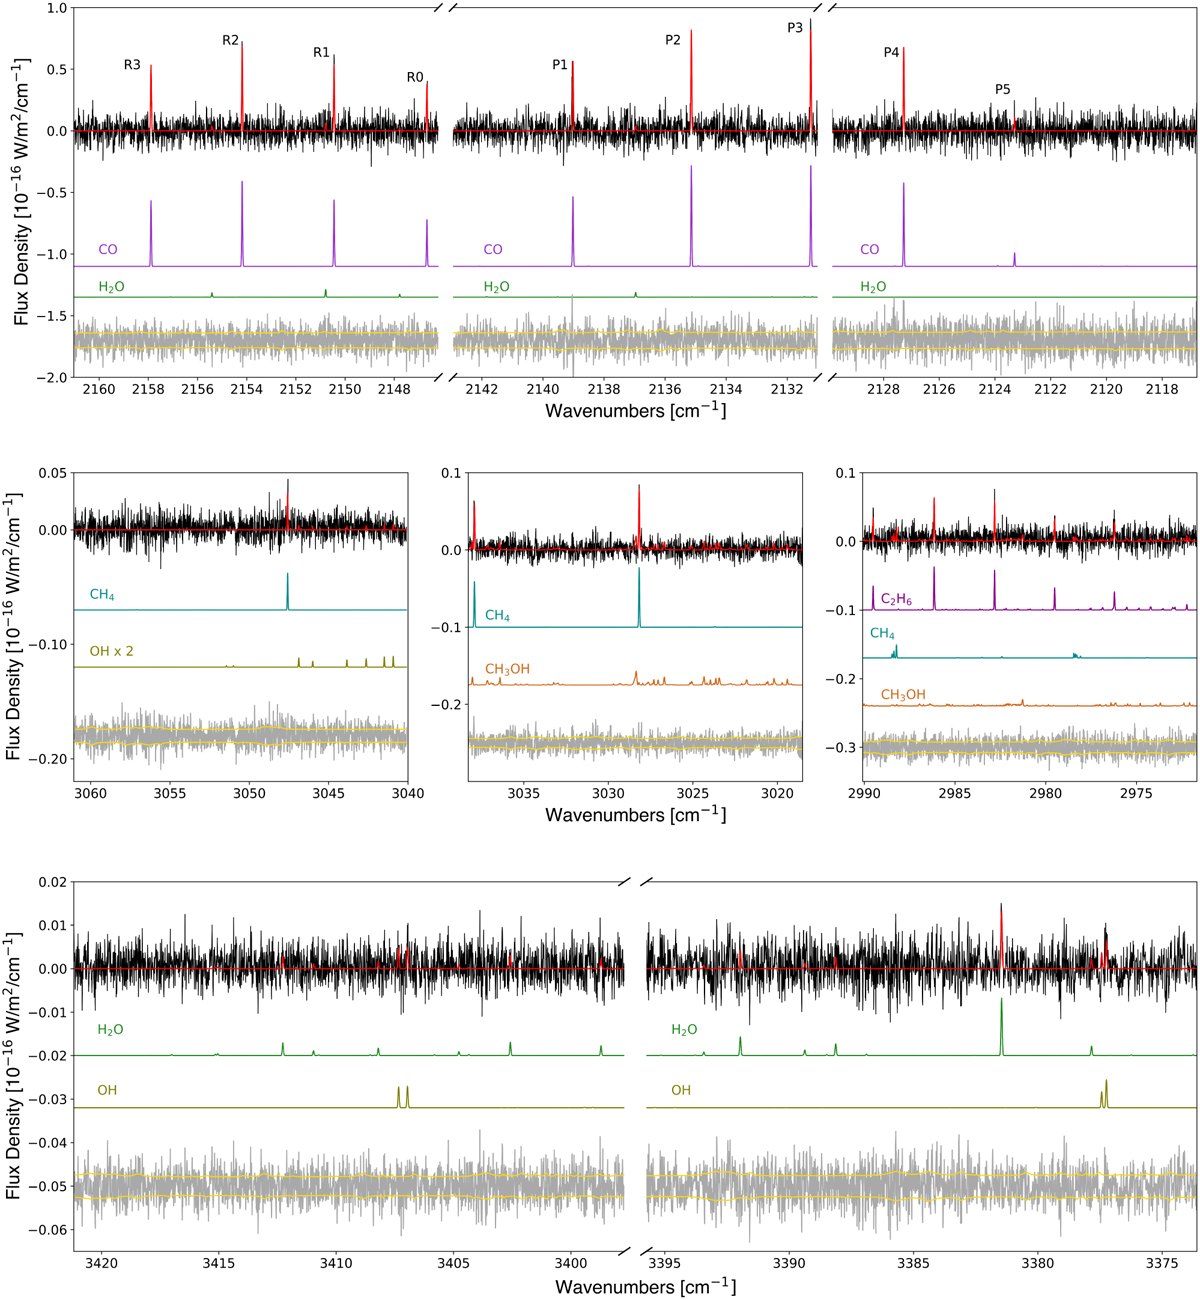
Selection of spectra of C/2023 H2 obtained with CRIRES+. The top panel shows the identification of many lines of CO in the M3418 setting (all the detectors, order 12). In the middle plots, we show from left to right emission lines of CH4 (setting L3302, detectors 1 and 2, order 17) and C2H6 (setting L3377, detector 1, order 17); other species such as methanol and OH are barely visible. In the bottom panel, we show detection of water and OH, in setting L3302, detectors 1 and 2, and order 19. For each panel, the modelled spectra is shown in red; single models are shifted from the observed spectra and colour-coded (CO: orchid, H2O: green, C2H6: dark magenta, CH4: dark cyan, CH3OH: chocolate, OH (prompt emission): olive). Below the models, we plotted in grey the residual (after subtraction of the modelled emissions) together with the expected stochastic noise envelope (±1σ) in yellow.
Current usage metrics show cumulative count of Article Views (full-text article views including HTML views, PDF and ePub downloads, according to the available data) and Abstracts Views on Vision4Press platform.
Data correspond to usage on the plateform after 2015. The current usage metrics is available 48-96 hours after online publication and is updated daily on week days.
Initial download of the metrics may take a while.