Fig. 1.
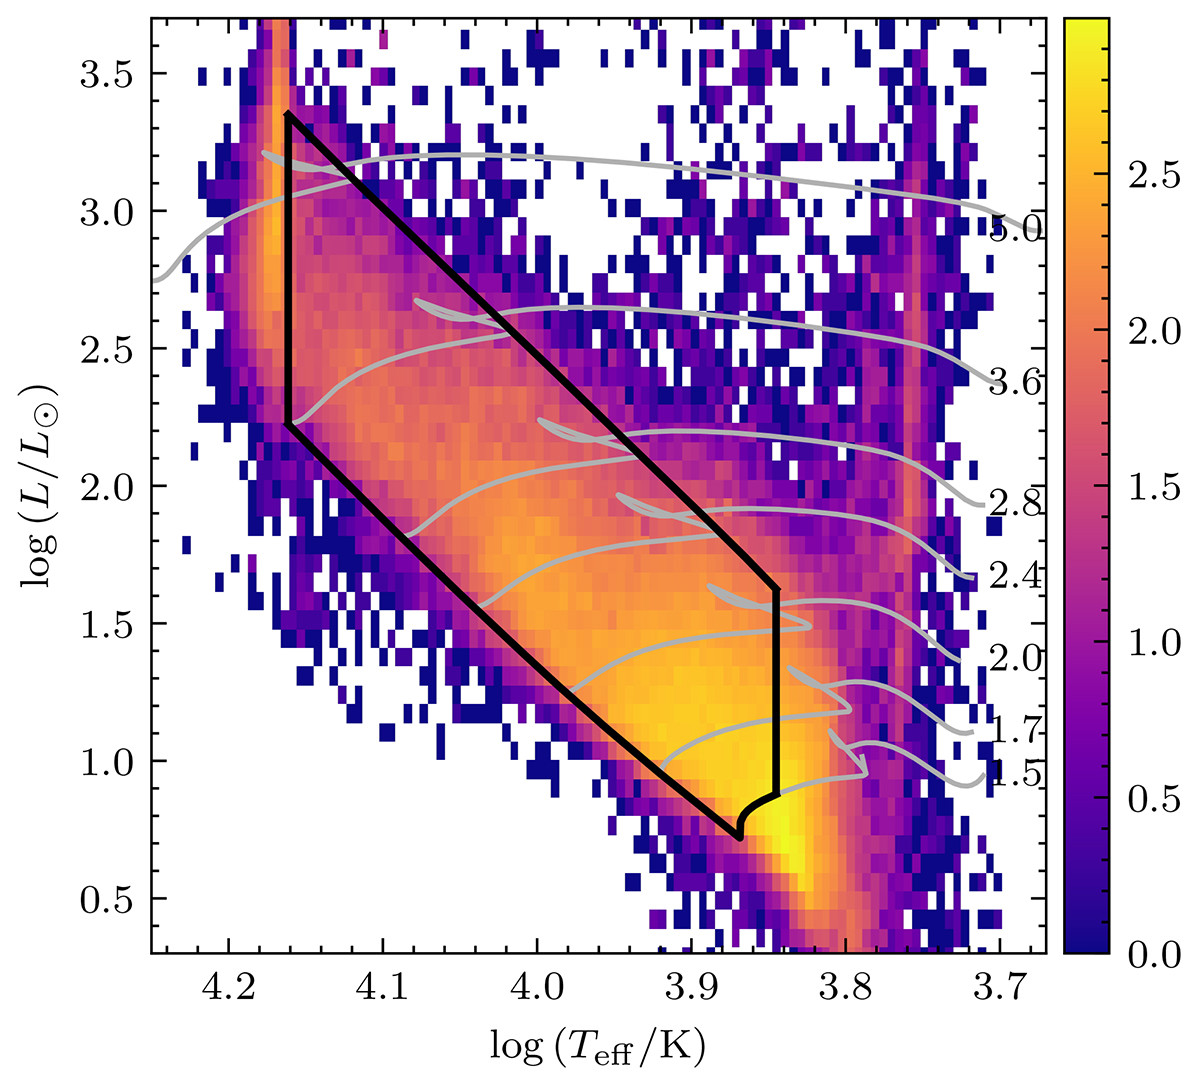
Download original image
HR diagram for the full sample. Evolutionary tracks for stars of masses 1.5, 1.7, 2.0, 2.4, 2.8, 3.6, and 5 M⊙ are illustrated as gray curves. Black lines indicate selection boundaries for stars with M/M⊙ ≥ 1.5 of solar metallicity, incorporating vertical temperature limits at 14 500 K and 7000 K. Color gradients denote the stellar density in each bin on a logarithmic scale. The spikes at the hot (Teff ∼ 15 000 K) and cool (Teff ∼ 6000 K) ends correspond to the temperature limits of the training models.
Current usage metrics show cumulative count of Article Views (full-text article views including HTML views, PDF and ePub downloads, according to the available data) and Abstracts Views on Vision4Press platform.
Data correspond to usage on the plateform after 2015. The current usage metrics is available 48-96 hours after online publication and is updated daily on week days.
Initial download of the metrics may take a while.