Fig. 11.
Download original image
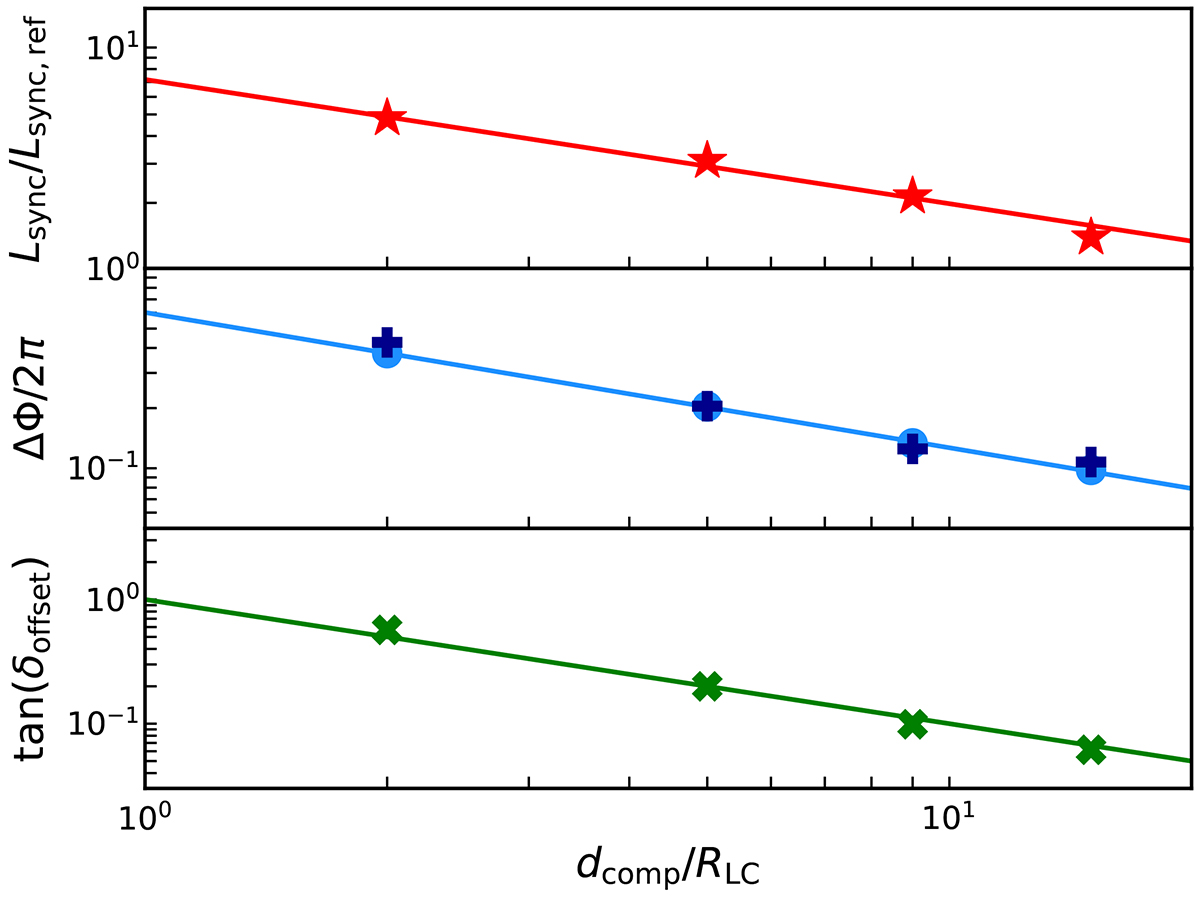
Light curves properties as a function of the pulsar-companion separation. Upper panel: integrated synchrotron power over the whole orbit (red points), normalized by the power computed for the isolated pulsar. The total synchrotron power scales as ![]() (red line). Middle panel: the orbital phase difference between peaks (light blue points) scales as
(red line). Middle panel: the orbital phase difference between peaks (light blue points) scales as ![]() (light blue line). We plot the corresponding 1/Γ factors normalized by a factor 0.55, computed before the companion for each run (dark blue crosses). Lower panel: angular offsets of the emitting cone with respect to the pulsar-companion direction (green points) and ratio of the wind drift velocity components Vϕ/Vr = RLC/r (green line) given by the monopole analytical solution (Michel 1973).
(light blue line). We plot the corresponding 1/Γ factors normalized by a factor 0.55, computed before the companion for each run (dark blue crosses). Lower panel: angular offsets of the emitting cone with respect to the pulsar-companion direction (green points) and ratio of the wind drift velocity components Vϕ/Vr = RLC/r (green line) given by the monopole analytical solution (Michel 1973).
Current usage metrics show cumulative count of Article Views (full-text article views including HTML views, PDF and ePub downloads, according to the available data) and Abstracts Views on Vision4Press platform.
Data correspond to usage on the plateform after 2015. The current usage metrics is available 48-96 hours after online publication and is updated daily on week days.
Initial download of the metrics may take a while.