Fig. 9.
Download original image
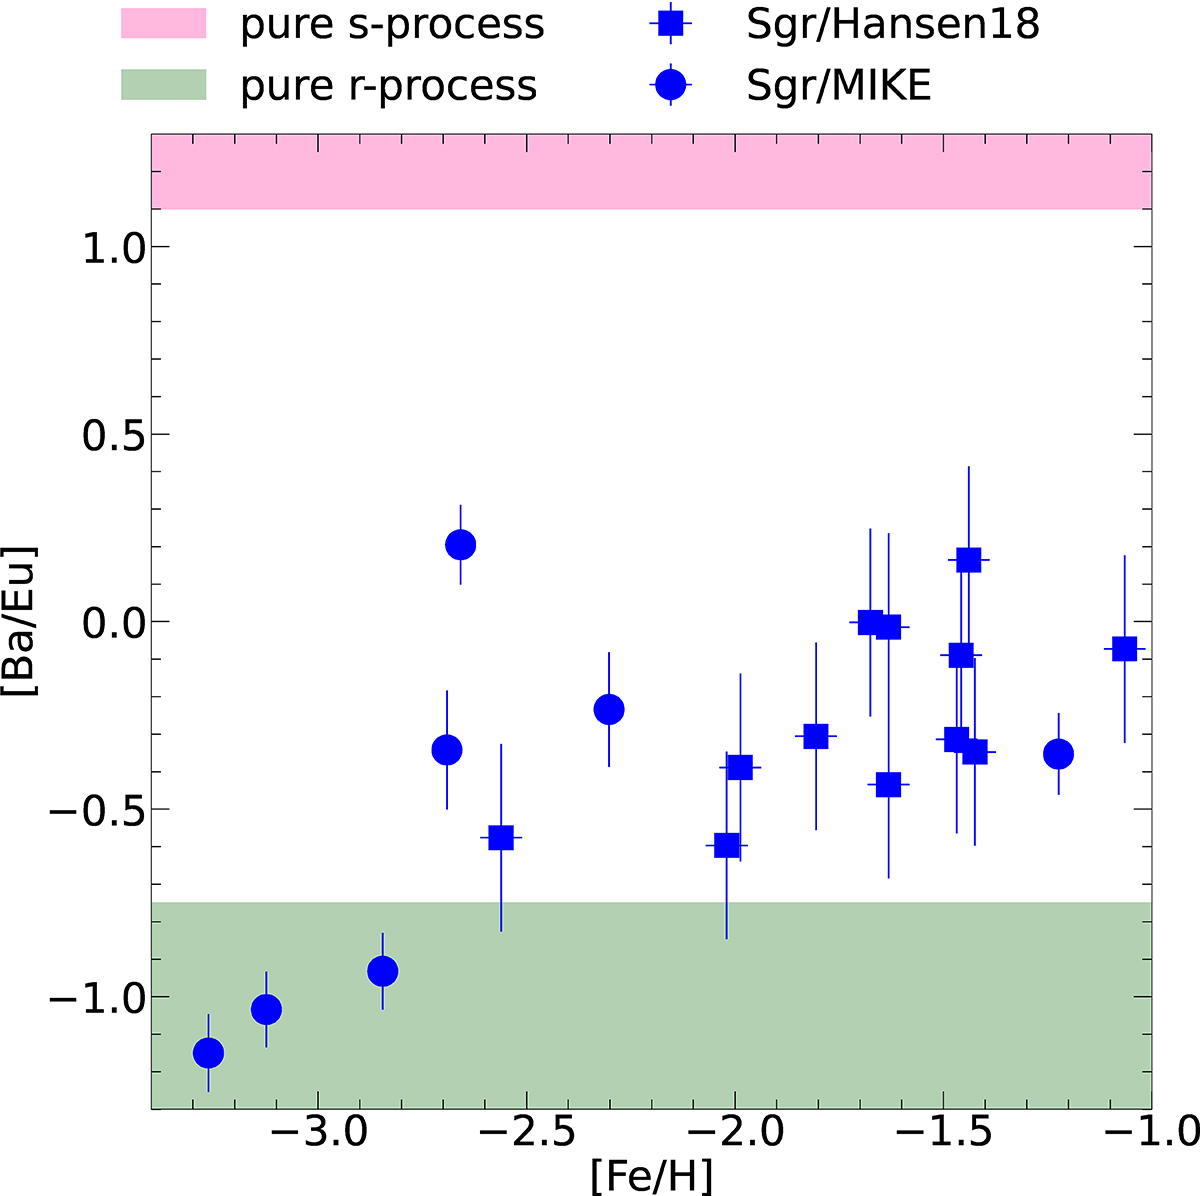
[Ba/Eu] vs. [Fe/H]. Blue circles and squares denote Sgr members from this work and from Hansen et al. (2018), respectively. The green shaded area delimits the region where [Ba/Eu] is purely produced by r-process channels, while the pink shaded area indicates the region where this ratio is produced by AGBs only (Arlandini et al. 1999; Bisterzo et al. 2014).
Current usage metrics show cumulative count of Article Views (full-text article views including HTML views, PDF and ePub downloads, according to the available data) and Abstracts Views on Vision4Press platform.
Data correspond to usage on the plateform after 2015. The current usage metrics is available 48-96 hours after online publication and is updated daily on week days.
Initial download of the metrics may take a while.