Fig. 6.
Download original image
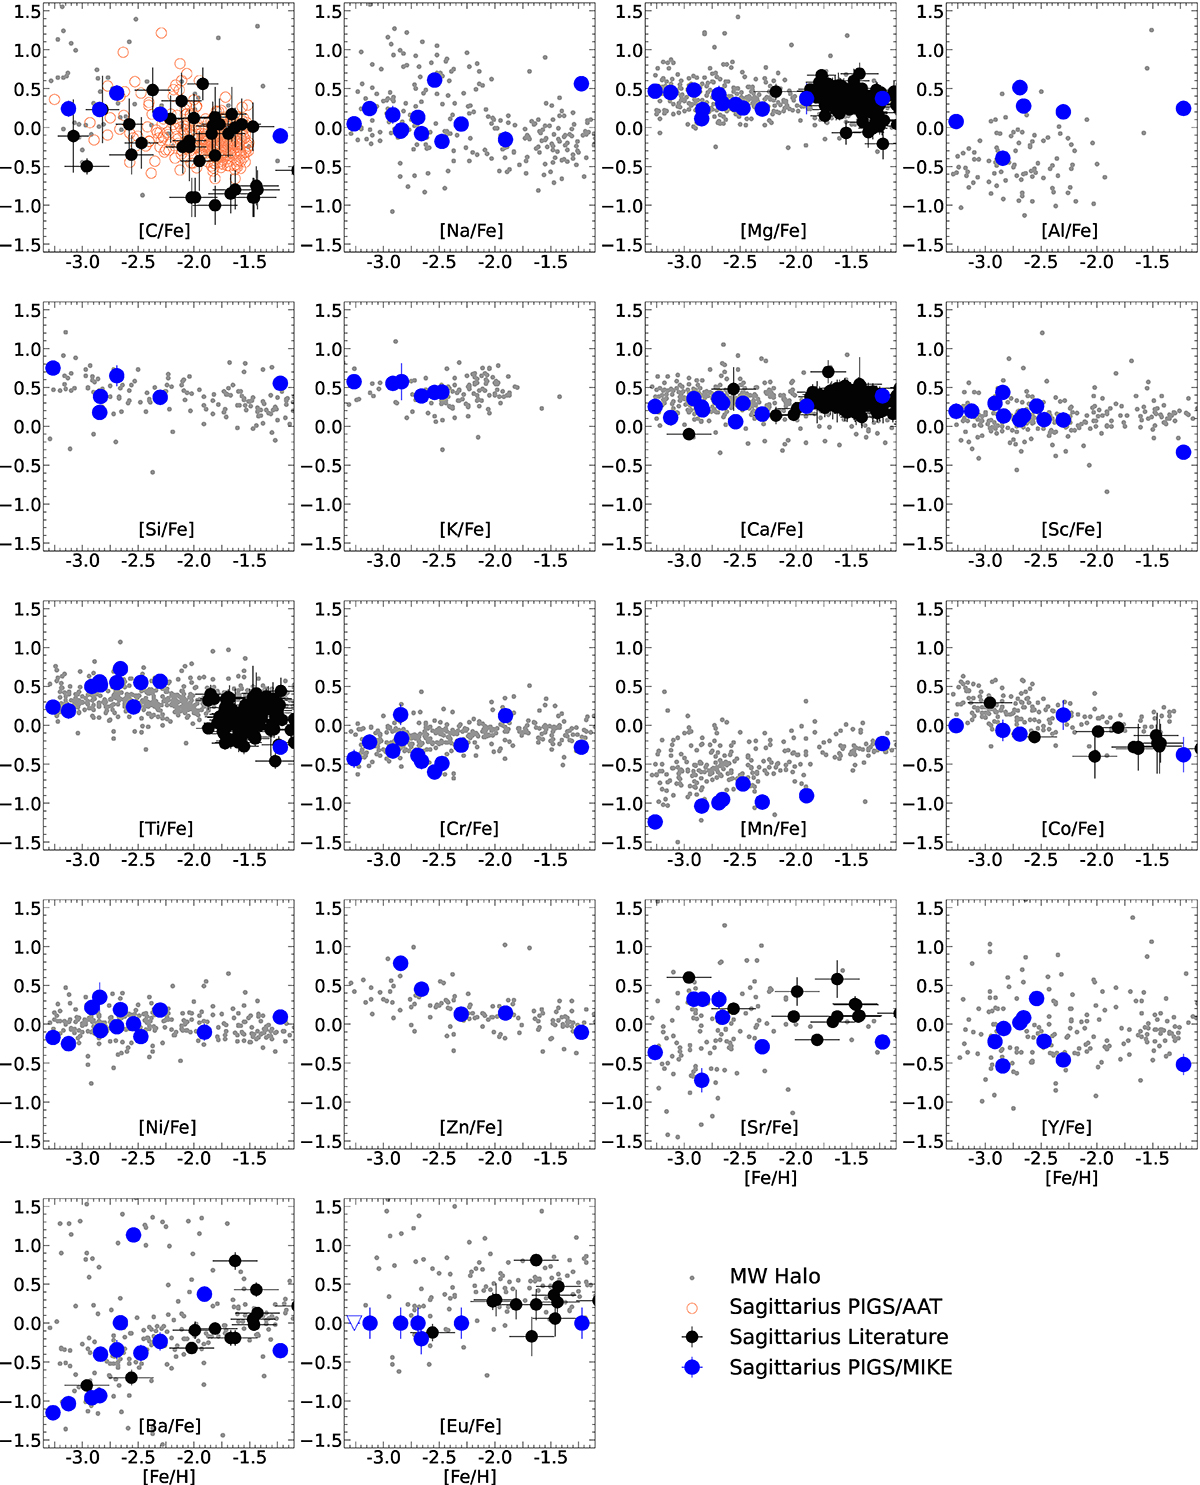
Chemical abundances [X/Fe] as a function of [Fe/H]. Sgr stars analysed in this work are marked with blue circles. For [C/Fe], values are corrected for stellar evolution effects as in Placco et al. (2014). MW halo stars are from SAGA database (Suda et al. 2008) and they are denoted by grey small circles. Literature stars of Sgr (black circles) for the various [X/Fe] are from Monaco et al. (2005), Mucciarelli et al. (2017), Hansen et al. (2018), except for [C/Fe] which are from Hansen et al. (2018), Chiti & Frebel (2019), Chiti et al. (2020), and Sestito et al. (2024a). All datasets are in LTE. Halo stars have been selected to be all giants for a more fair comparison. Open triangle in our Eu measurement denotes an upper limit.
Current usage metrics show cumulative count of Article Views (full-text article views including HTML views, PDF and ePub downloads, according to the available data) and Abstracts Views on Vision4Press platform.
Data correspond to usage on the plateform after 2015. The current usage metrics is available 48-96 hours after online publication and is updated daily on week days.
Initial download of the metrics may take a while.