Fig. 2.
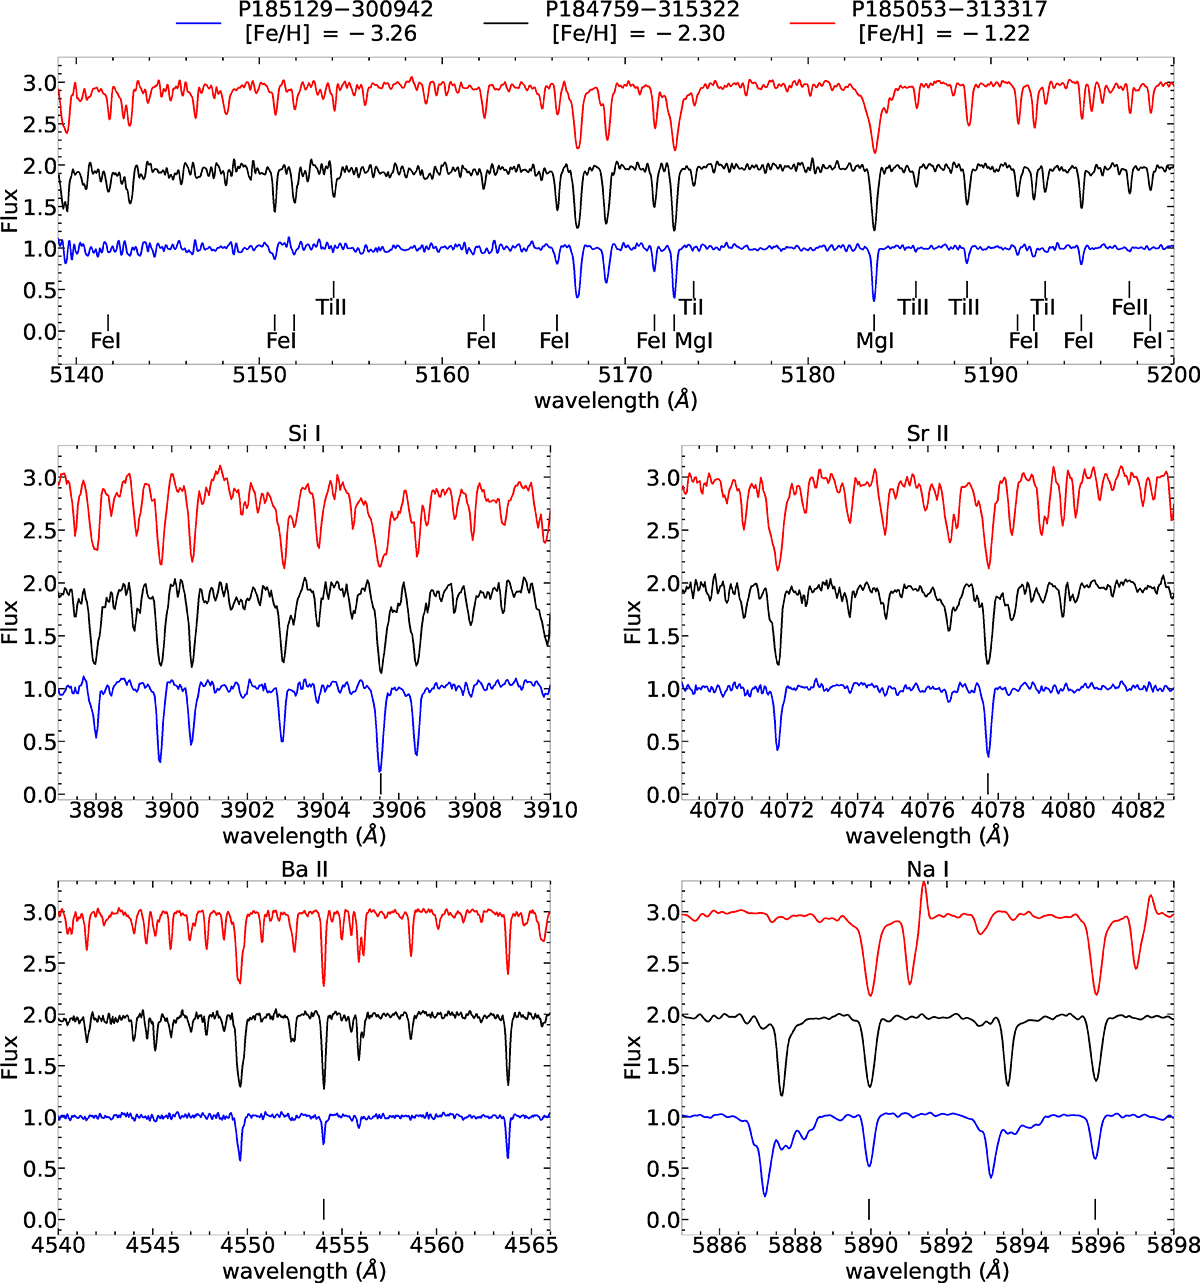
Download original image
Example of MIKE spectra. Top panel: Mg I Triplet region, which also includes several Fe and Ti lines. Vertical short lines marks the position of Mg I, Ti, and Fe lines found in most of the targets. Central left panel: Si I 3905.523 Å line region. Central right: Sr II 4077.709 Å line region. Bottom left: Ba II 4554.029 Å line region. Bottom right: Na I Doublet λλ5889.951, 5895.924 Å lines region, which also includes spectral lines from various clouds of the interstellar medium. The S/N of these spectra, measured in the Mg Ib Triplet region, ranges from ∼24 to ∼56. Vertical short lines in the central and bottom panels indicate the position of the Si (central left), Sr (central right), Ba (bottom left), and Na (bottom right) spectral lines.
Current usage metrics show cumulative count of Article Views (full-text article views including HTML views, PDF and ePub downloads, according to the available data) and Abstracts Views on Vision4Press platform.
Data correspond to usage on the plateform after 2015. The current usage metrics is available 48-96 hours after online publication and is updated daily on week days.
Initial download of the metrics may take a while.