Fig. 6
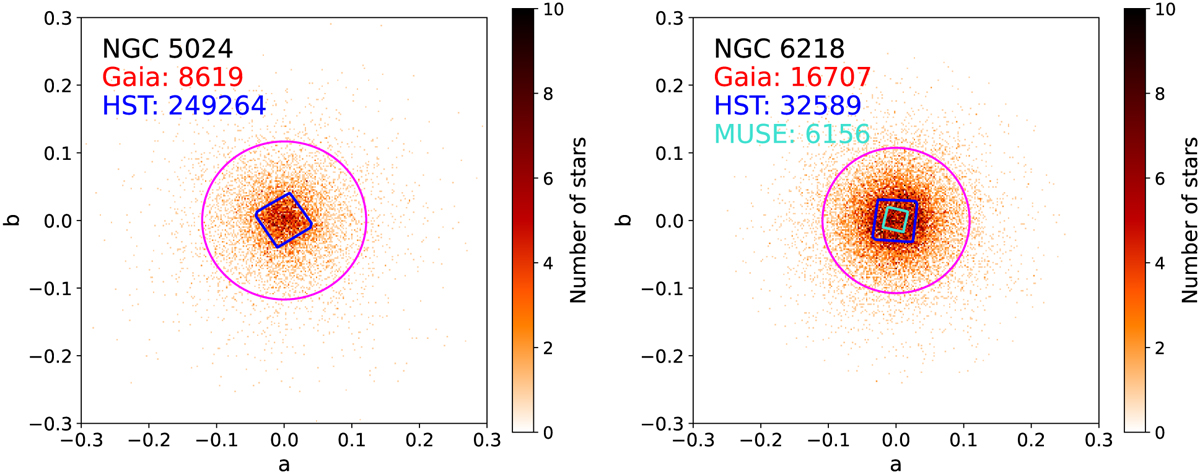
Download original image
Comparison of the samples used to determine ellipticities in this study and that of F14. The color bar is used to indicate the density of sources in the Gaia data. The magenta ellipse represents the results of the PCA analysis. The major and minor axes are aligned with the plot axes, and the stars were rotated to match this alignment. The blue contour shows the data used by F14 to measure their ellipticities, which was originally compiled by Sarajedini et al. (2007) using the HST The turquoise contour represents footprint of the stars in the M23 sample. The numbers at the top correspond to the number of stars in each sample.
Current usage metrics show cumulative count of Article Views (full-text article views including HTML views, PDF and ePub downloads, according to the available data) and Abstracts Views on Vision4Press platform.
Data correspond to usage on the plateform after 2015. The current usage metrics is available 48-96 hours after online publication and is updated daily on week days.
Initial download of the metrics may take a while.