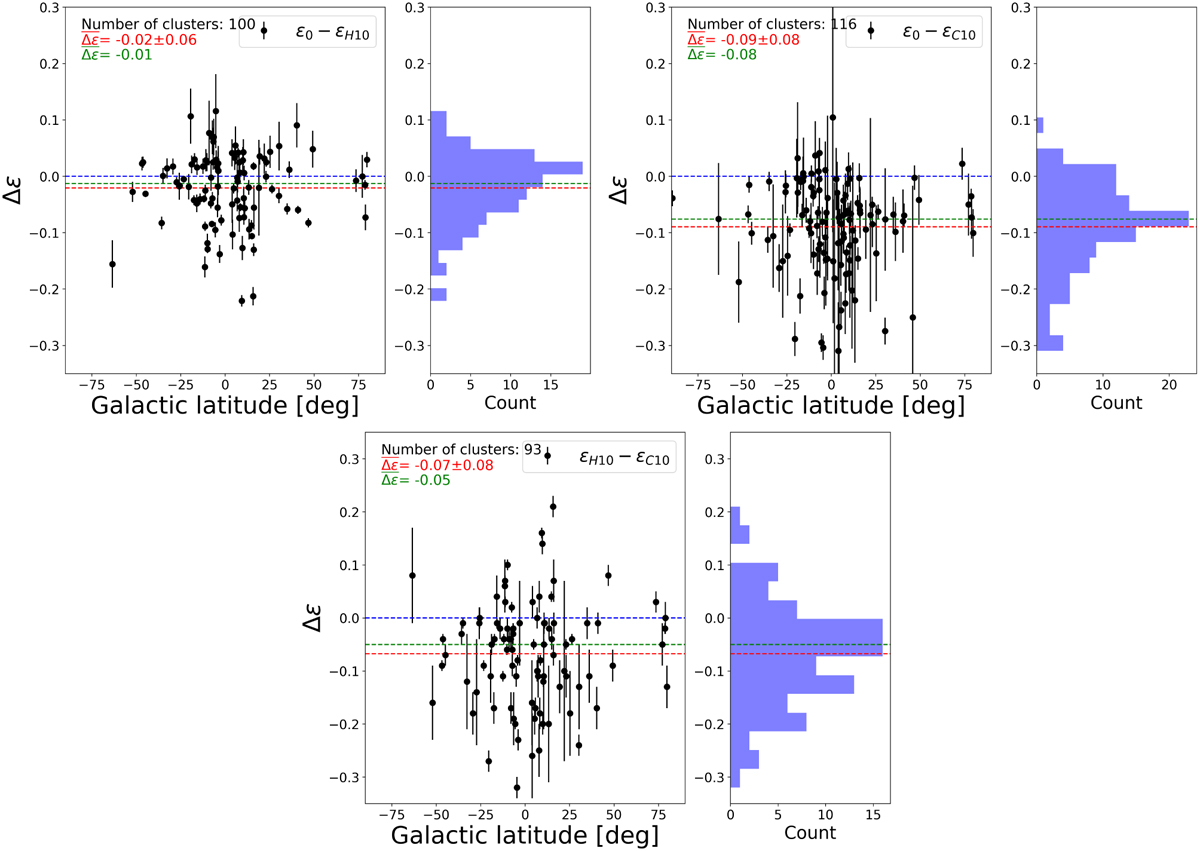
Fig. 4
Download original image
Comparison of the ellipticities obtained in different studies. All clusters present in both datasets are included, regardless of the number of stars considered in the PCA analysis. The ellipticities measured in this study are denoted by ϵ0. The error bars represent the sum in quadrature of the uncertainties in both measurements, except for comparisons involving H10, as the catalog does not report uncertainties. As a reference point, we added a dashed blue line around zero. The dotted red line indicates the mean difference between the ellipticities, and the green line shows the median. The red numbers displayed in the top left corner of each panel indicate the mean difference and its standard deviation. The green numbers represent the median difference. A histogram is placed on the right side of each figure to facilitate visualization of Δϵ.
Current usage metrics show cumulative count of Article Views (full-text article views including HTML views, PDF and ePub downloads, according to the available data) and Abstracts Views on Vision4Press platform.
Data correspond to usage on the plateform after 2015. The current usage metrics is available 48-96 hours after online publication and is updated daily on week days.
Initial download of the metrics may take a while.