Fig. 11
Download original image
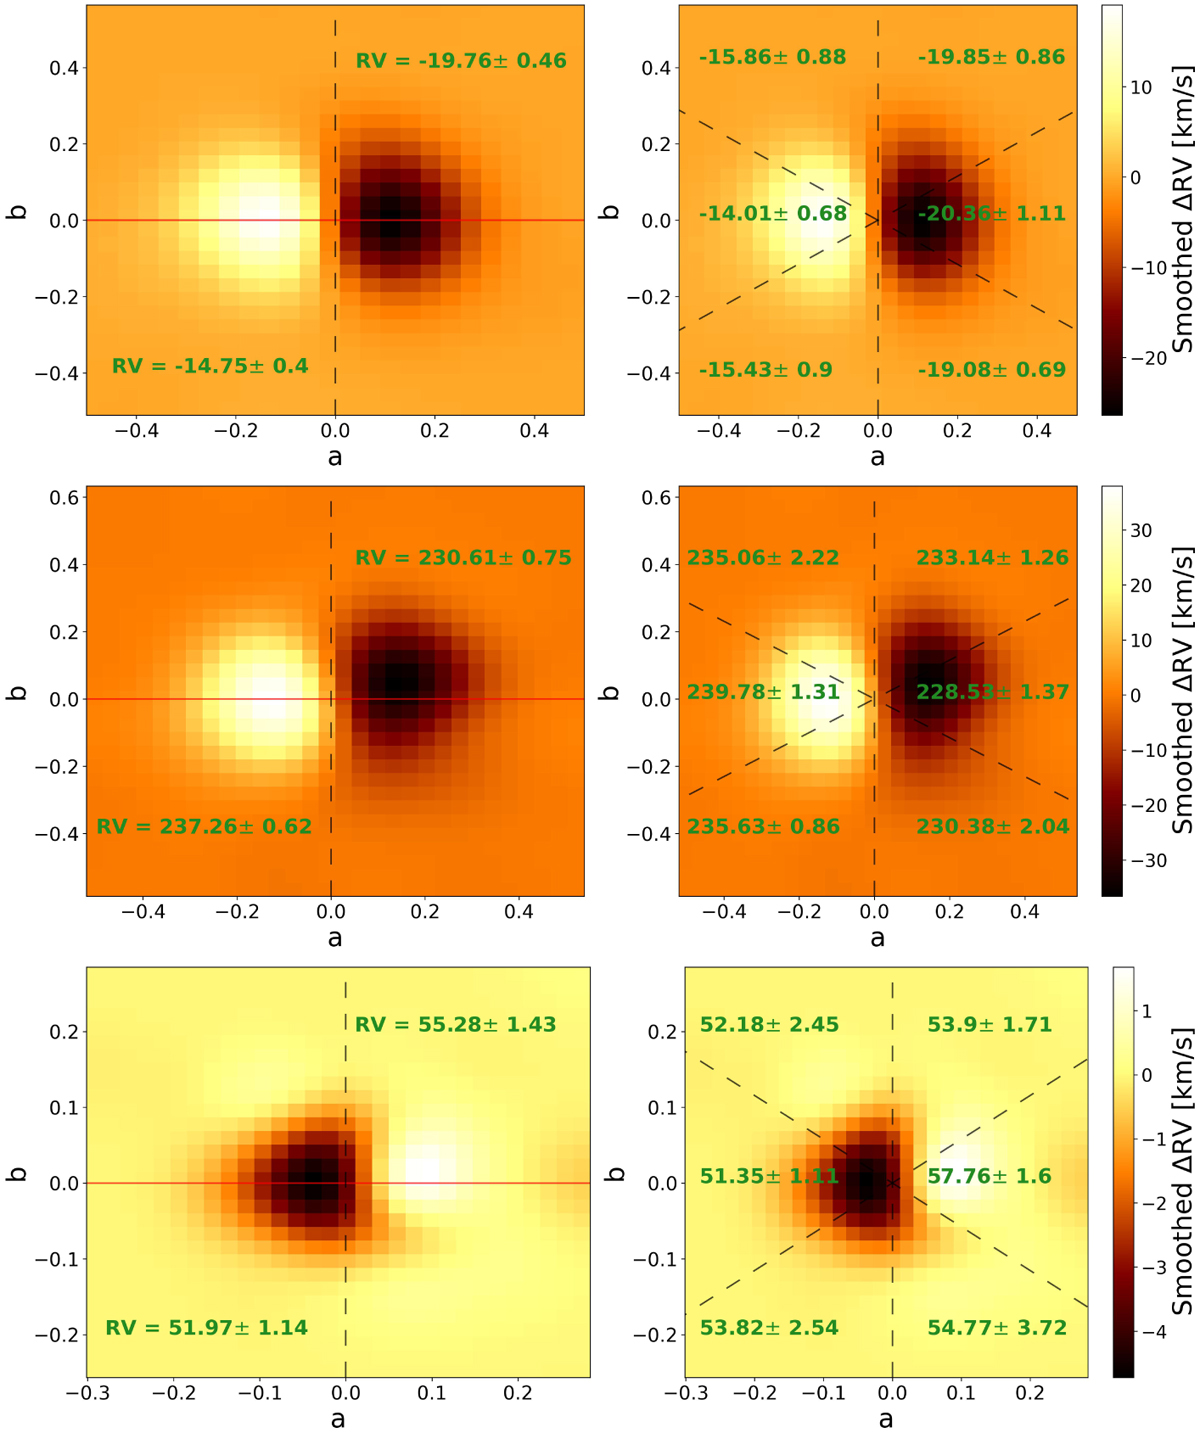
Radial velocity maps of NGC 104 (top), NGC 5139 (middle), and NGC 5904 (bottom). Left: the red line is oriented in the direction of the major axis of the ellipse, and the dashed black line is aligned with the minor axis. The minor axis divides the sample of stars into two subsamples, with the median RV and the error on the median for each shown in green. The plot is color-coded based on the difference between the local value of RV and the median RV of the cluster. Right: same set of stars as in the left panel. The cluster was divided into six subsections. Stars with an RV difference greater than 100 km s−1 with respect to the median were not used to generate the RV maps. The plot is only used for a data visualization and not to measure the RV difference between the subsamples.
Current usage metrics show cumulative count of Article Views (full-text article views including HTML views, PDF and ePub downloads, according to the available data) and Abstracts Views on Vision4Press platform.
Data correspond to usage on the plateform after 2015. The current usage metrics is available 48-96 hours after online publication and is updated daily on week days.
Initial download of the metrics may take a while.