Open Access
Fig. 2.
Download original image
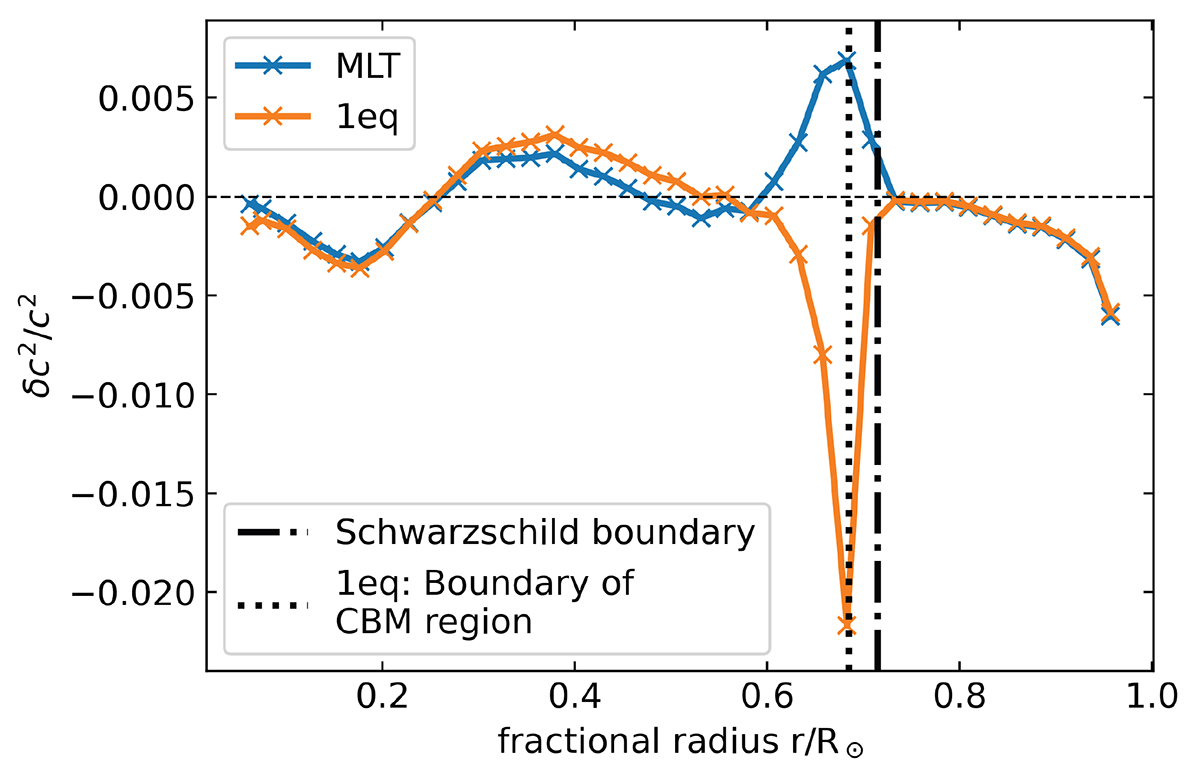
Sound speed profile as determined by Basu et al. (2009) compared to the profile predicted by SSM-MLT (blue) and by SSM-K1 (orange). The y-axis shows the relative difference in the squared sound speed between the observation ![]() and the models
and the models ![]() :
: ![]() .
.
Current usage metrics show cumulative count of Article Views (full-text article views including HTML views, PDF and ePub downloads, according to the available data) and Abstracts Views on Vision4Press platform.
Data correspond to usage on the plateform after 2015. The current usage metrics is available 48-96 hours after online publication and is updated daily on week days.
Initial download of the metrics may take a while.