Fig. 1.
Download original image
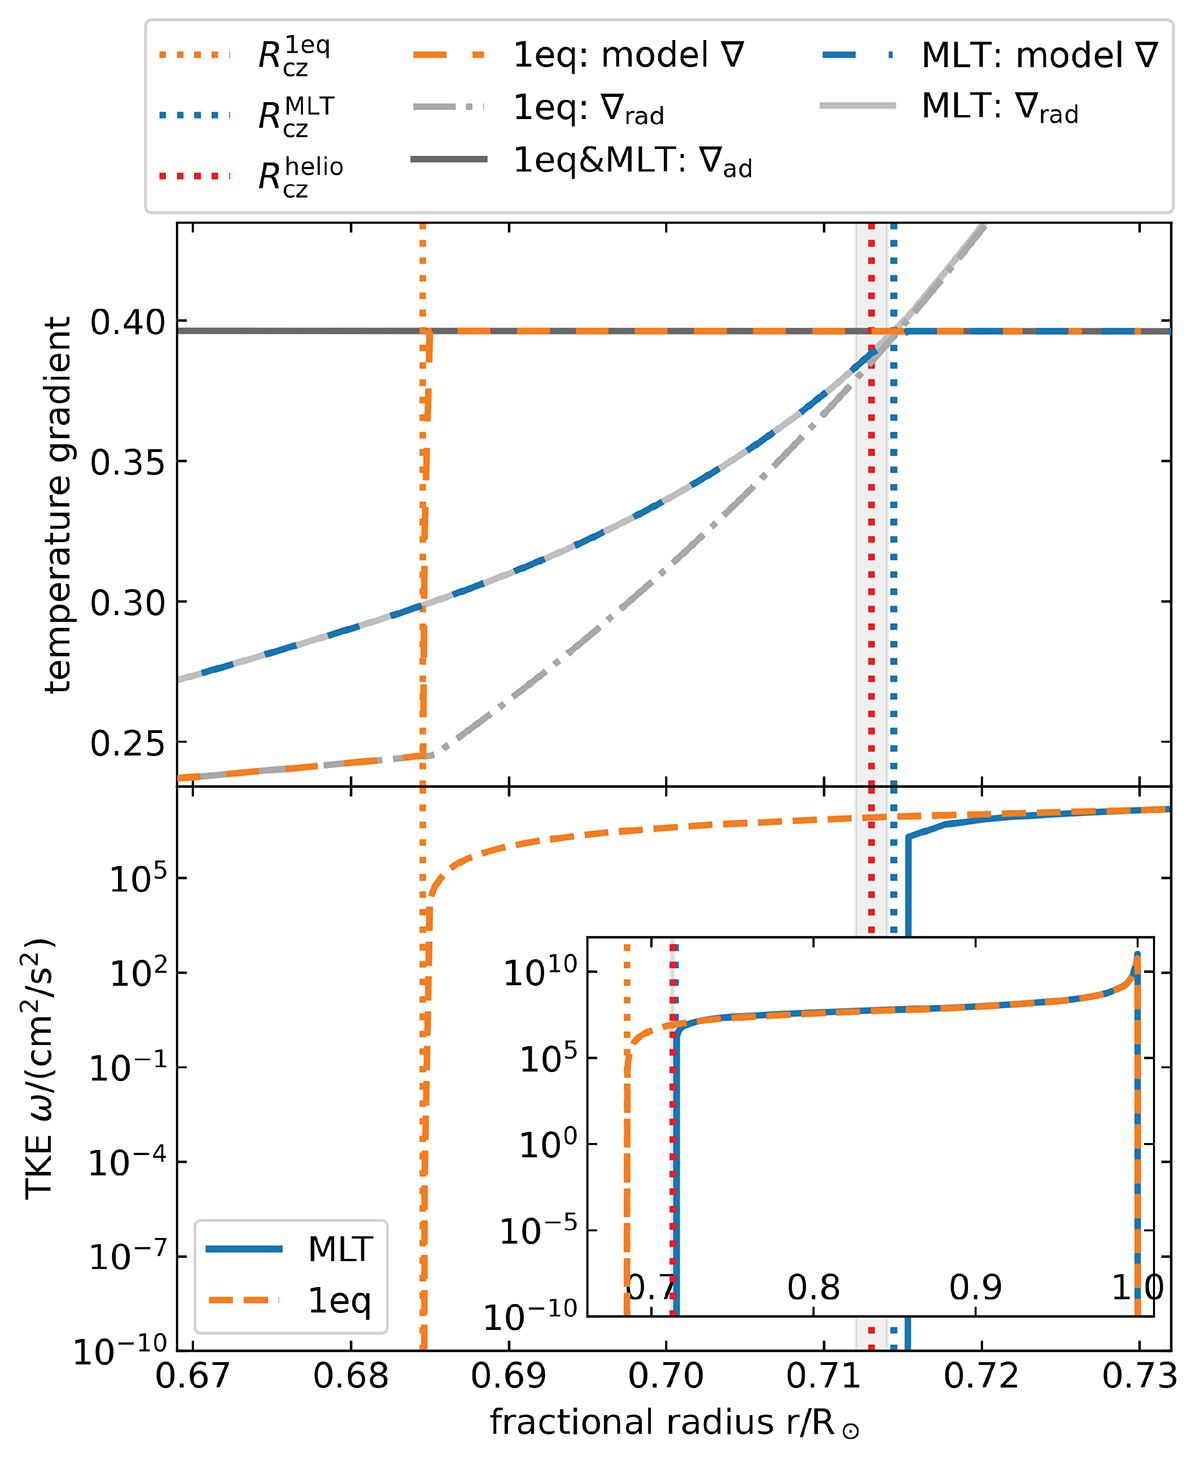
Temperature stratification (upper panel) and TKE ω (lower panel) in the region of the convective boundary, calculated with the 1-equation model (orange) and with MLT (blue). The adiabatic (∇ad, dark grey), radiative (∇rad: light grey, MLT: solid, 1-equation model: dash-dotted), and model temperature gradients are shown. ∇ad is the same for the 1-equation model and MLT. For the 1-equation model, ∇ is slightly subadiabatic in the CBM region and sharply changes to ∇rad when ω (lower panel) drops to zero. The inset in the lower panel shows the complete convective envelope. The vertical lines mark the boundaries of the convective regions (orange: 1-equation model, blue: MLT) and the helioseismic measurement (red, Basu & Antia 1997), whereas the grey shaded regions denote the uncertainty of the measurement.
Current usage metrics show cumulative count of Article Views (full-text article views including HTML views, PDF and ePub downloads, according to the available data) and Abstracts Views on Vision4Press platform.
Data correspond to usage on the plateform after 2015. The current usage metrics is available 48-96 hours after online publication and is updated daily on week days.
Initial download of the metrics may take a while.