Fig. 5
Download original image
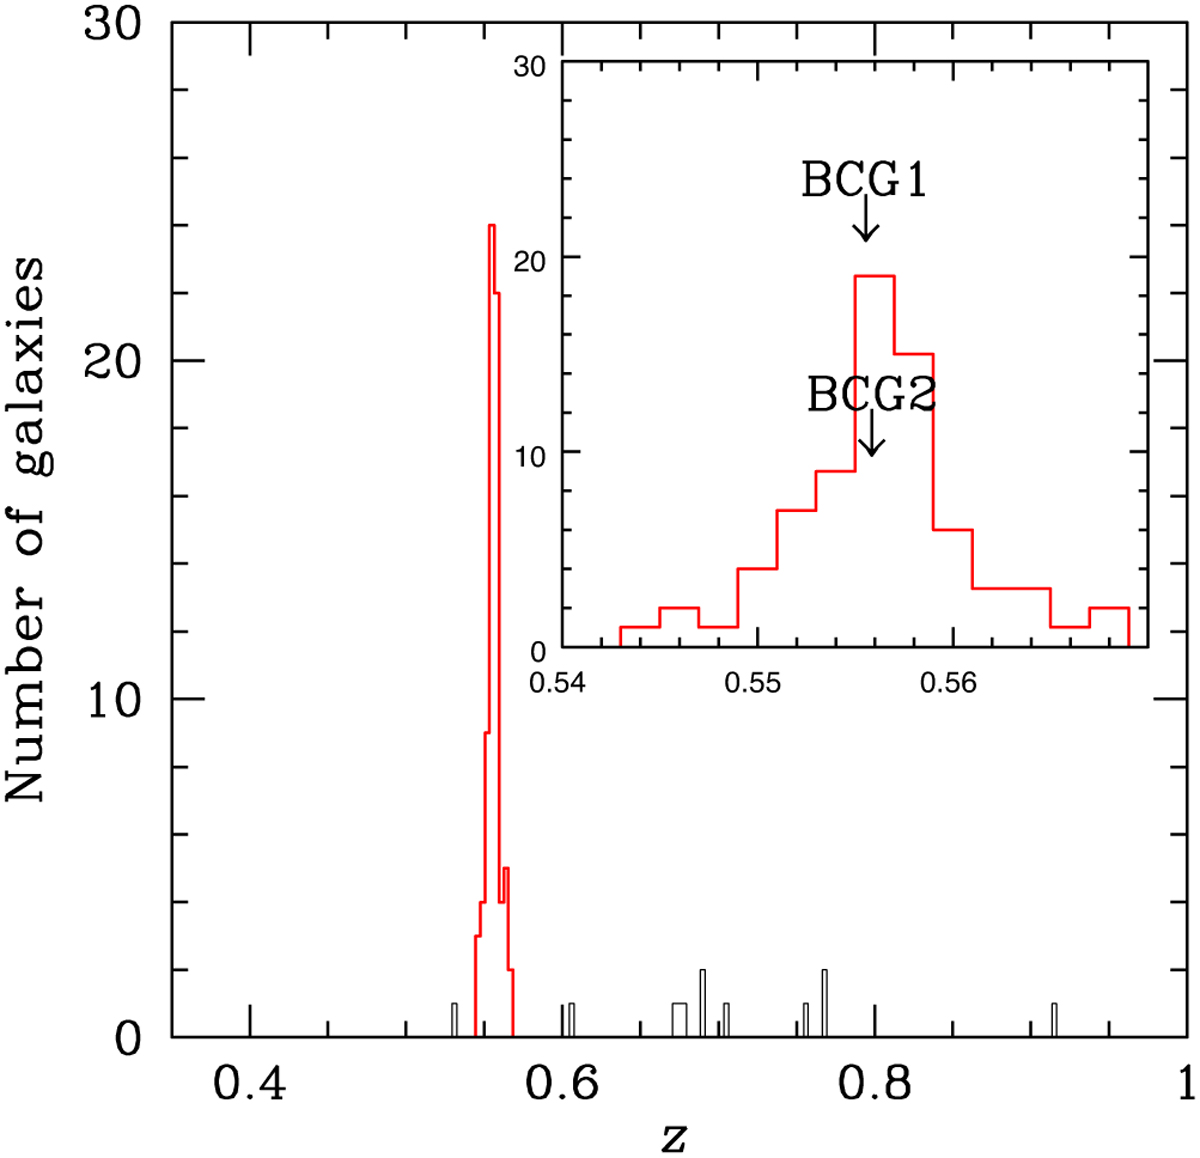
Histogram referring to all the galaxies with a spectroscopic redshift in the region of PSZ2 G282.28+49.94. The heavy, red line histogram refers to the 73 galaxies assigned to the G282 peak according to the 1D-DEDICA reconstruction method. The inset figure shows the 73 member galaxies and the arrows indicate the redshift of BCG1 and BCG2.
Current usage metrics show cumulative count of Article Views (full-text article views including HTML views, PDF and ePub downloads, according to the available data) and Abstracts Views on Vision4Press platform.
Data correspond to usage on the plateform after 2015. The current usage metrics is available 48-96 hours after online publication and is updated daily on week days.
Initial download of the metrics may take a while.