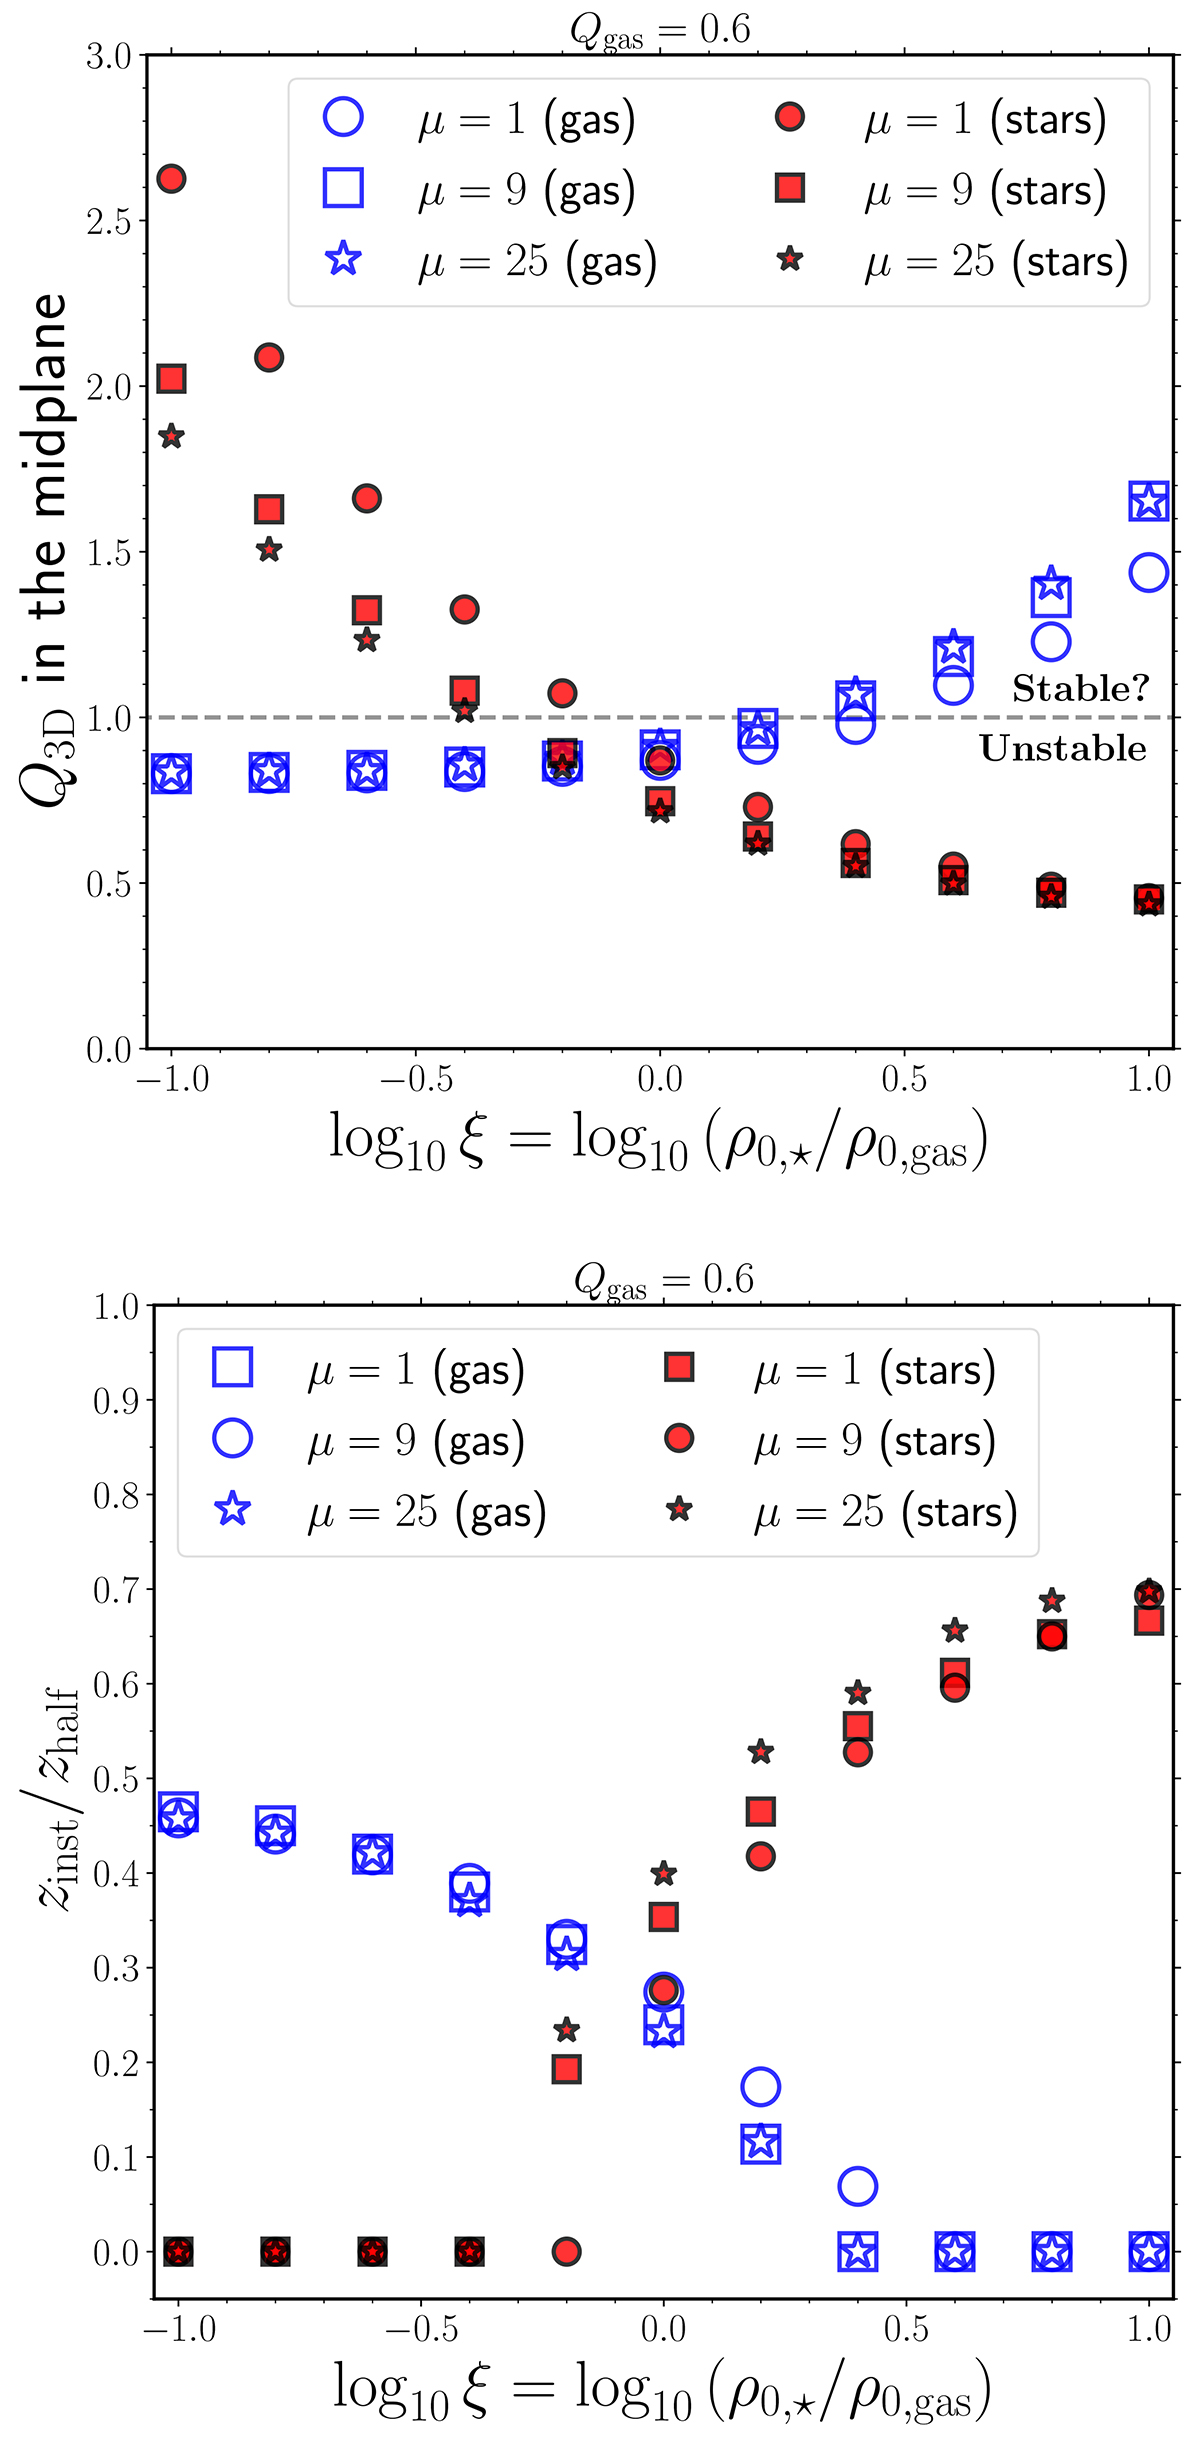
Fig. 4.
Download original image
Upper panel: Midplane values of Q3D, ⋆ (filled symbols) and Q3D, gas (empty symbols) as functions of the midplane star-to-gas density ratio, ξ, for different values of the star-to-gas squared velocity dispersion ratio, μ. The horizontal dashed line indicates the instability threshold, Q3D = 1. Lower panel: Extent of the unstable strip above the midplane for the stellar (zinst, ⋆, normalised to zhalf, ⋆; filled symbols) and gaseous (zinst, gas, normalised to zhalf, gas; empty symbols) components as functions of ξ for different values of μ. In both panels, we assume that Qgas = 0.6.
Current usage metrics show cumulative count of Article Views (full-text article views including HTML views, PDF and ePub downloads, according to the available data) and Abstracts Views on Vision4Press platform.
Data correspond to usage on the plateform after 2015. The current usage metrics is available 48-96 hours after online publication and is updated daily on week days.
Initial download of the metrics may take a while.