Fig. 1.
Download original image
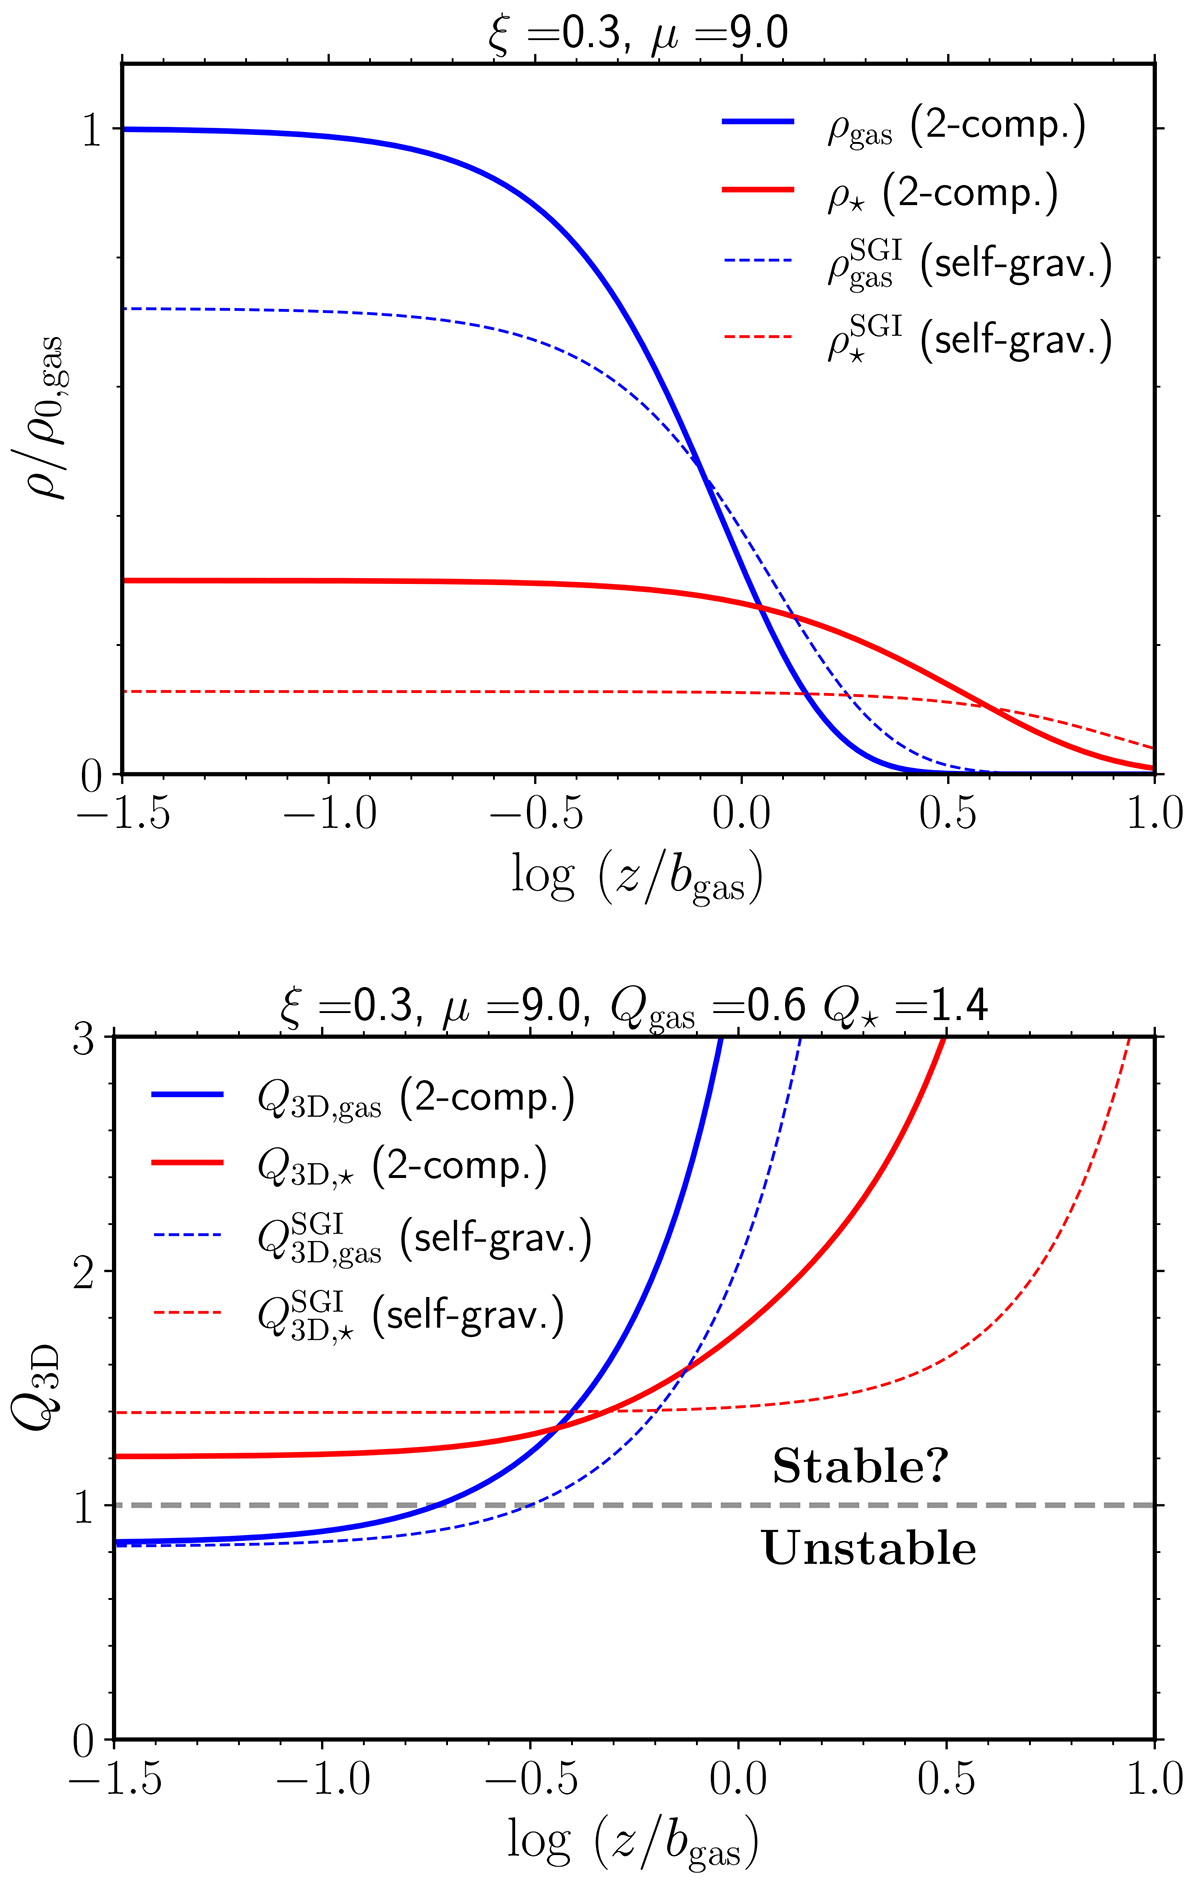
Upper panel: Vertical density profiles (solid curves) of gas and stars of a two-component isothermal disc with μ = 9 and ξ = 0.3. The dashed curves are the profiles of the corresponding SGI models with the same velocity dispersion and surface density. Lower panel: Vertical Q3D profiles of the same models as in the upper panel, assuming Qgas = 0.6 (and thus Q⋆ = 1.4). The horizontal dashed line indicates the instability threshold, Q3D = 1. Here, ρ0, gas and bgas are, respectively, the midplane density and the scale height of the gaseous component of the two-component disc.
Current usage metrics show cumulative count of Article Views (full-text article views including HTML views, PDF and ePub downloads, according to the available data) and Abstracts Views on Vision4Press platform.
Data correspond to usage on the plateform after 2015. The current usage metrics is available 48-96 hours after online publication and is updated daily on week days.
Initial download of the metrics may take a while.