Fig. A.1
Download original image
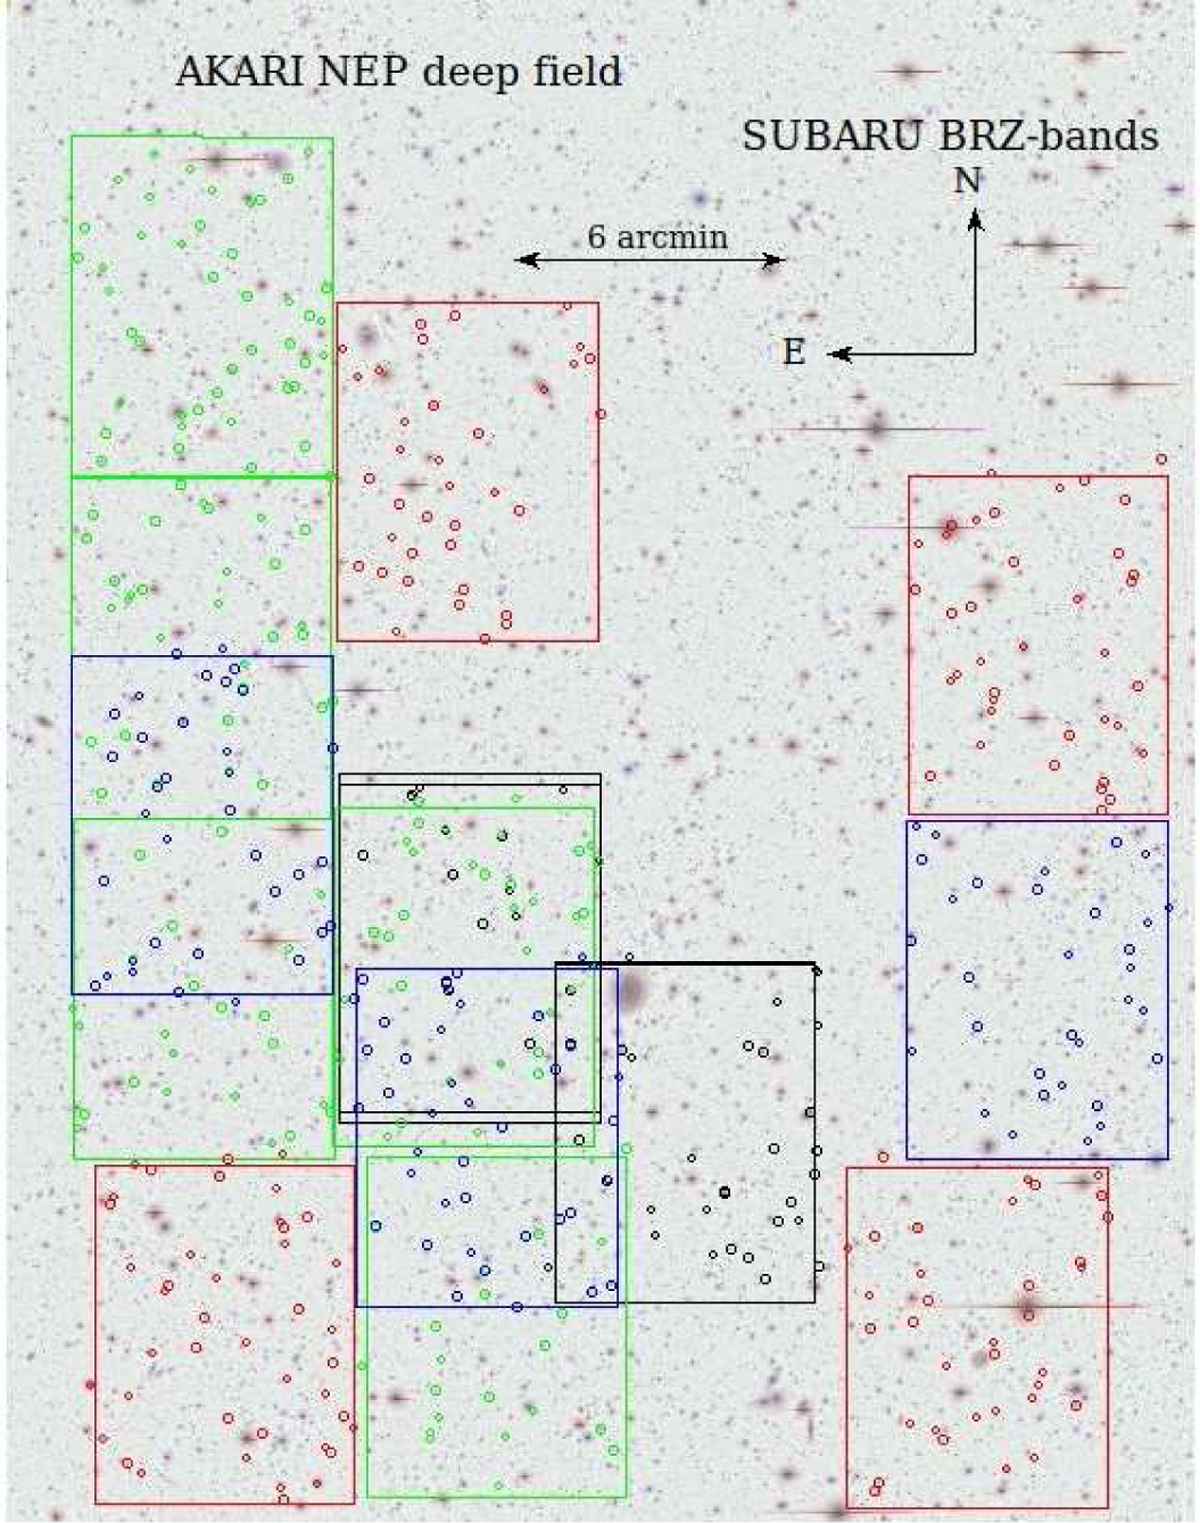
Mask positions of OSIRIS/GTC in the AKARI NEP Deep Field. Boxes show the OSIRIS coverage area in the different pointings used. Small circles show the objects selected for spectroscopy in each mask. Colors indicate the observation cycle in which each mask and target were used; green for GTC7-14AMEX, red for GTC4-15AMEX, blue for GTC4-15BMEX, and black for GTC4-17AMEX cycles, respectively.
Current usage metrics show cumulative count of Article Views (full-text article views including HTML views, PDF and ePub downloads, according to the available data) and Abstracts Views on Vision4Press platform.
Data correspond to usage on the plateform after 2015. The current usage metrics is available 48-96 hours after online publication and is updated daily on week days.
Initial download of the metrics may take a while.