Fig. 8
Download original image
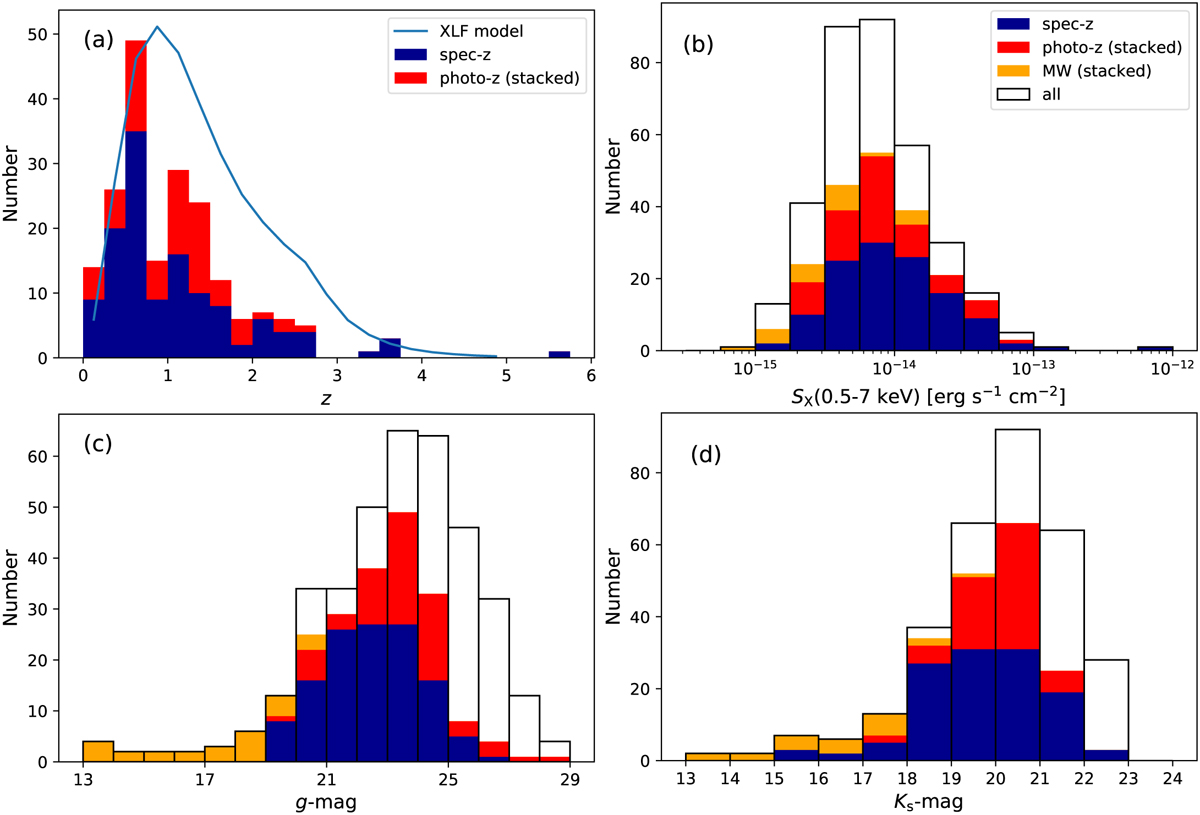
Redshift and flux distribution histograms. (a) Redshift histogram of the spec-z (dark blue histogram) and photo-z (red histogram) samples, where the latter is stacked onto the former. The model expected redshift distribution of AGNs obtained with the X-ray luminosity function model by Miyaji et al. (2015) for our Chandra ANEPD survey is overplotted. (b) X-ray (0.5–7 keV) [SX(0.5–7 keV)] histogram of the X-ray sources in our ID catalog. In addition to the histograms for spec-z and photo-z samples, the distribution of Milky Way (MW) objects is also shown (orange histogram, stacked). The distribution of all objects in our sample is also shown as an un-filled histogram. (c, d) Histograms of g and Ks magnitudes for the X-ray sources that are detected in respective bands. The meaning of colors and styles of the histogram are the same as those in panel (b).
Current usage metrics show cumulative count of Article Views (full-text article views including HTML views, PDF and ePub downloads, according to the available data) and Abstracts Views on Vision4Press platform.
Data correspond to usage on the plateform after 2015. The current usage metrics is available 48-96 hours after online publication and is updated daily on week days.
Initial download of the metrics may take a while.