Fig. 7
Download original image
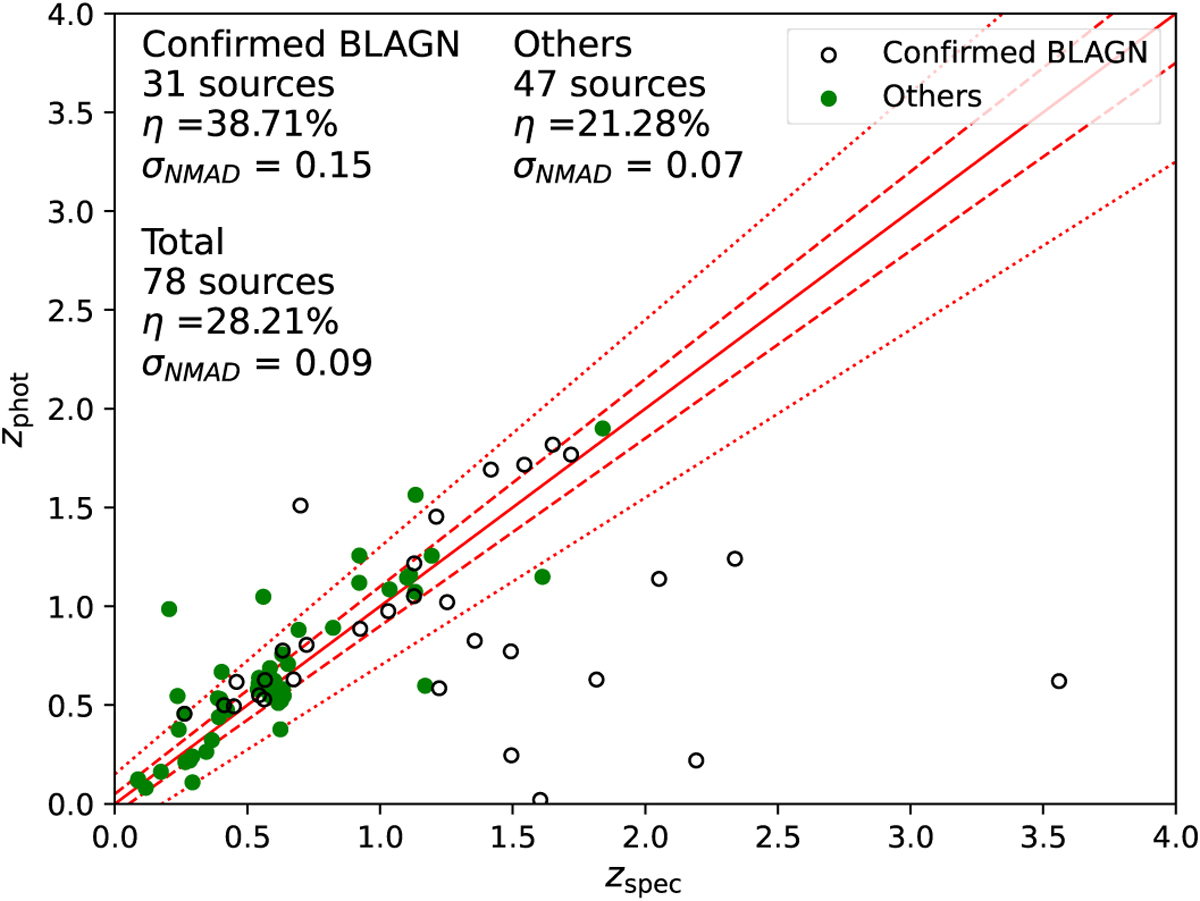
Comparison between spectroscopic redshift (zspec) and photometric redshift (zphot) from Oi et al. (2021) for the 66 sources that have both. Filled circles represent type 1 AGNs (CLASS=XAGN1 in Table 2) while open circles represent non-type 1 objects (CLASS=XAGN/XGAL). The outlier fraction (η) and NMAD (σNMAD) are shown as labels for each of the BL and non-BL objects. The solid red lines represent zspec = zphot and |zphot − zspec|/zspec = 0.05 relations, while red dotted lines correspond to the borders between outlier and non-outlier regimes, corresponding to |zphot − zspec|/zspec = 0.15.
Current usage metrics show cumulative count of Article Views (full-text article views including HTML views, PDF and ePub downloads, according to the available data) and Abstracts Views on Vision4Press platform.
Data correspond to usage on the plateform after 2015. The current usage metrics is available 48-96 hours after online publication and is updated daily on week days.
Initial download of the metrics may take a while.