Fig. 2
Download original image
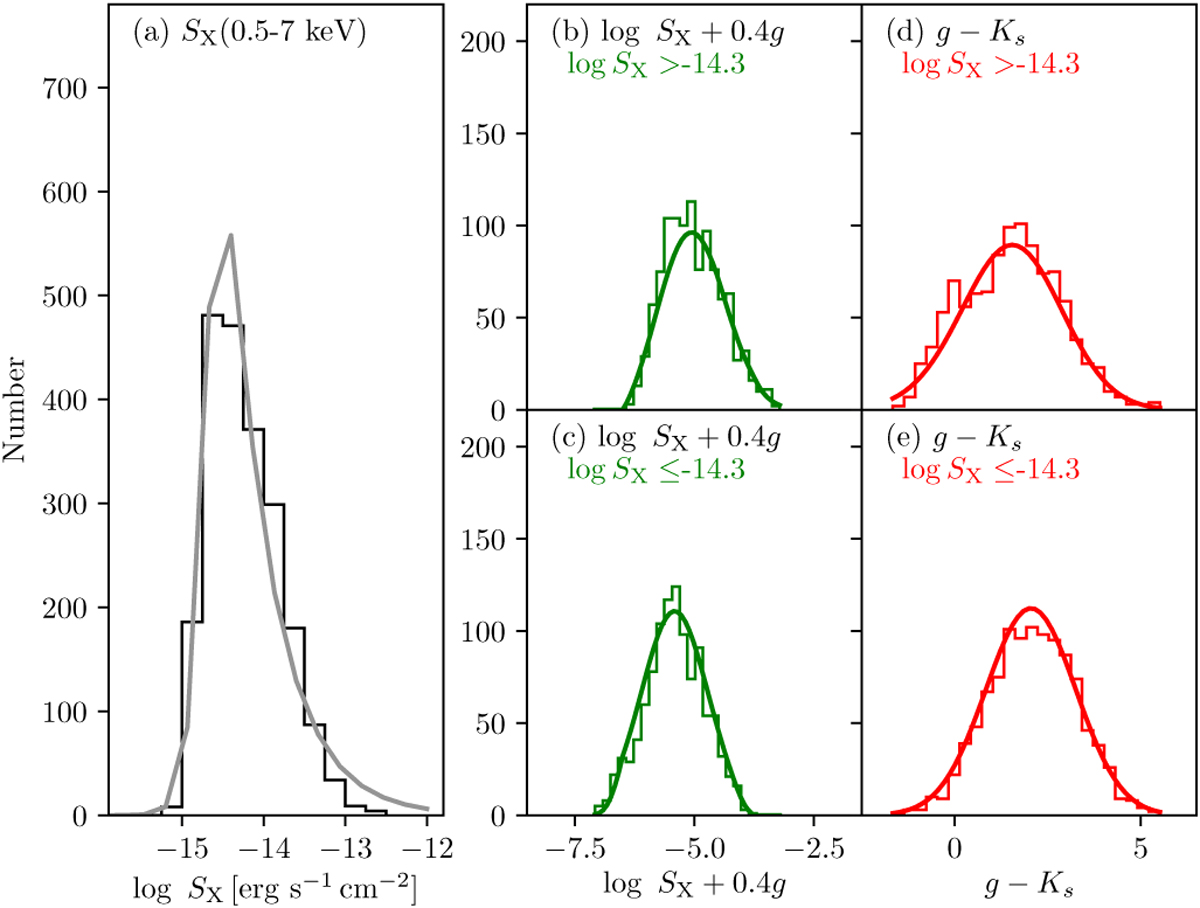
Histograms for sources detected in both g and Ks bands for template sample with models. (a) Histogram showing the dN/d log SX distribution of the template sample of X-ray sources that have both g and Ks, constructed from the COSMOS Legacy survey. The curve shows the best-fit model. (b, c) Histograms of log SX + 0.4g distribution of the template sample and the best-fit model (curve) for the high and low flux regimes respectively as labeled. (d, e) Same as (b, c) for the g − Ks distributions. In all panels, SX is the 0.5–7 keV flux in units of erg s−1 cm−2.
Current usage metrics show cumulative count of Article Views (full-text article views including HTML views, PDF and ePub downloads, according to the available data) and Abstracts Views on Vision4Press platform.
Data correspond to usage on the plateform after 2015. The current usage metrics is available 48-96 hours after online publication and is updated daily on week days.
Initial download of the metrics may take a while.