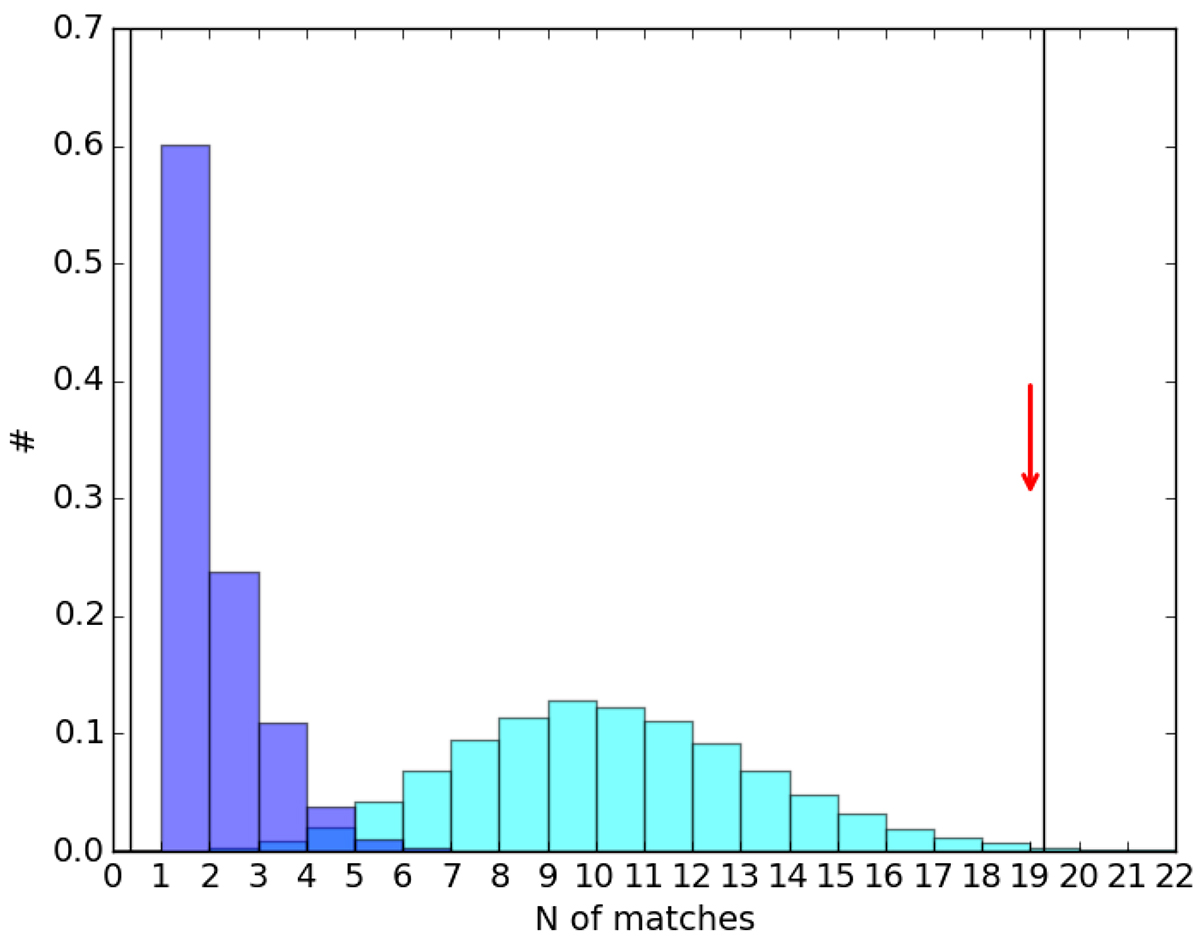
Fig. 2.
Download original image
Normalised distribution of the number of chance coincidences between GRBs and FRBs obtained by cross-matching the 105 realisations of GRB and FRB samples when only spatial and temporal constraints (cyan) were applied and when the distance constraint (blue) was also taken into account. The vertical solid lines mark the 3σ confidence interval, and the vertical arrow marks the number of matches using real samples when only spatial and temporal constraints were considered.
Current usage metrics show cumulative count of Article Views (full-text article views including HTML views, PDF and ePub downloads, according to the available data) and Abstracts Views on Vision4Press platform.
Data correspond to usage on the plateform after 2015. The current usage metrics is available 48-96 hours after online publication and is updated daily on week days.
Initial download of the metrics may take a while.