Open Access
Fig. 7
Download original image
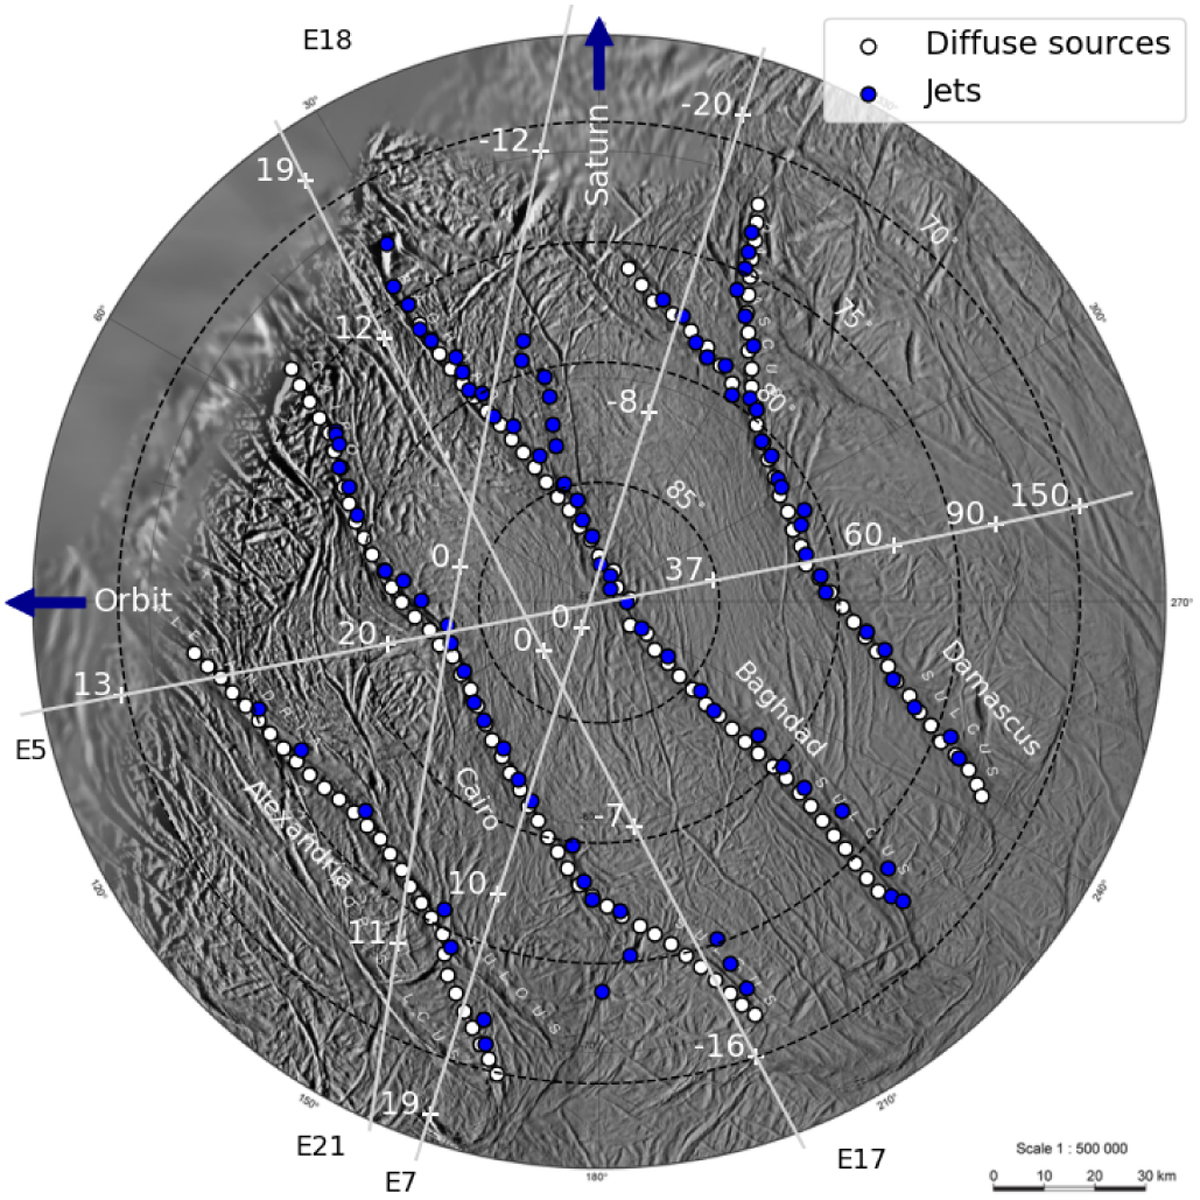
Map of the SPT with the ground tracks of the Cassini flybys used to constrain our model. The locations of diffuse salt-rich sources and the jets from Porco et al. (2014) are shown as white and blue circles, respectively.
Current usage metrics show cumulative count of Article Views (full-text article views including HTML views, PDF and ePub downloads, according to the available data) and Abstracts Views on Vision4Press platform.
Data correspond to usage on the plateform after 2015. The current usage metrics is available 48-96 hours after online publication and is updated daily on week days.
Initial download of the metrics may take a while.